
Analytics dimensions for your IT budget
Allocations answer "who pays". Analytics dimensions answer "who uses". Here is how it works.
To the question “who pays for this licence?”, chargeback tools answer without hesitating. But to the question “how much does cyber security cost us, all suppliers combined?”, we often have no answer.
Analytics dimensions bring that second reading. A lightweight, optional tag set on an item to state its nature: Infrastructure, Cloud Migration, Licences, Security. Configurable, of course.
The mechanics in KANAP
Creating dimensions
Head to Master Data > Analytics dimensions. Each dimension carries a unique name and a description. The description is mostly for your colleagues: “Hosting, cloud and virtualisation” reads better than “Infra”.
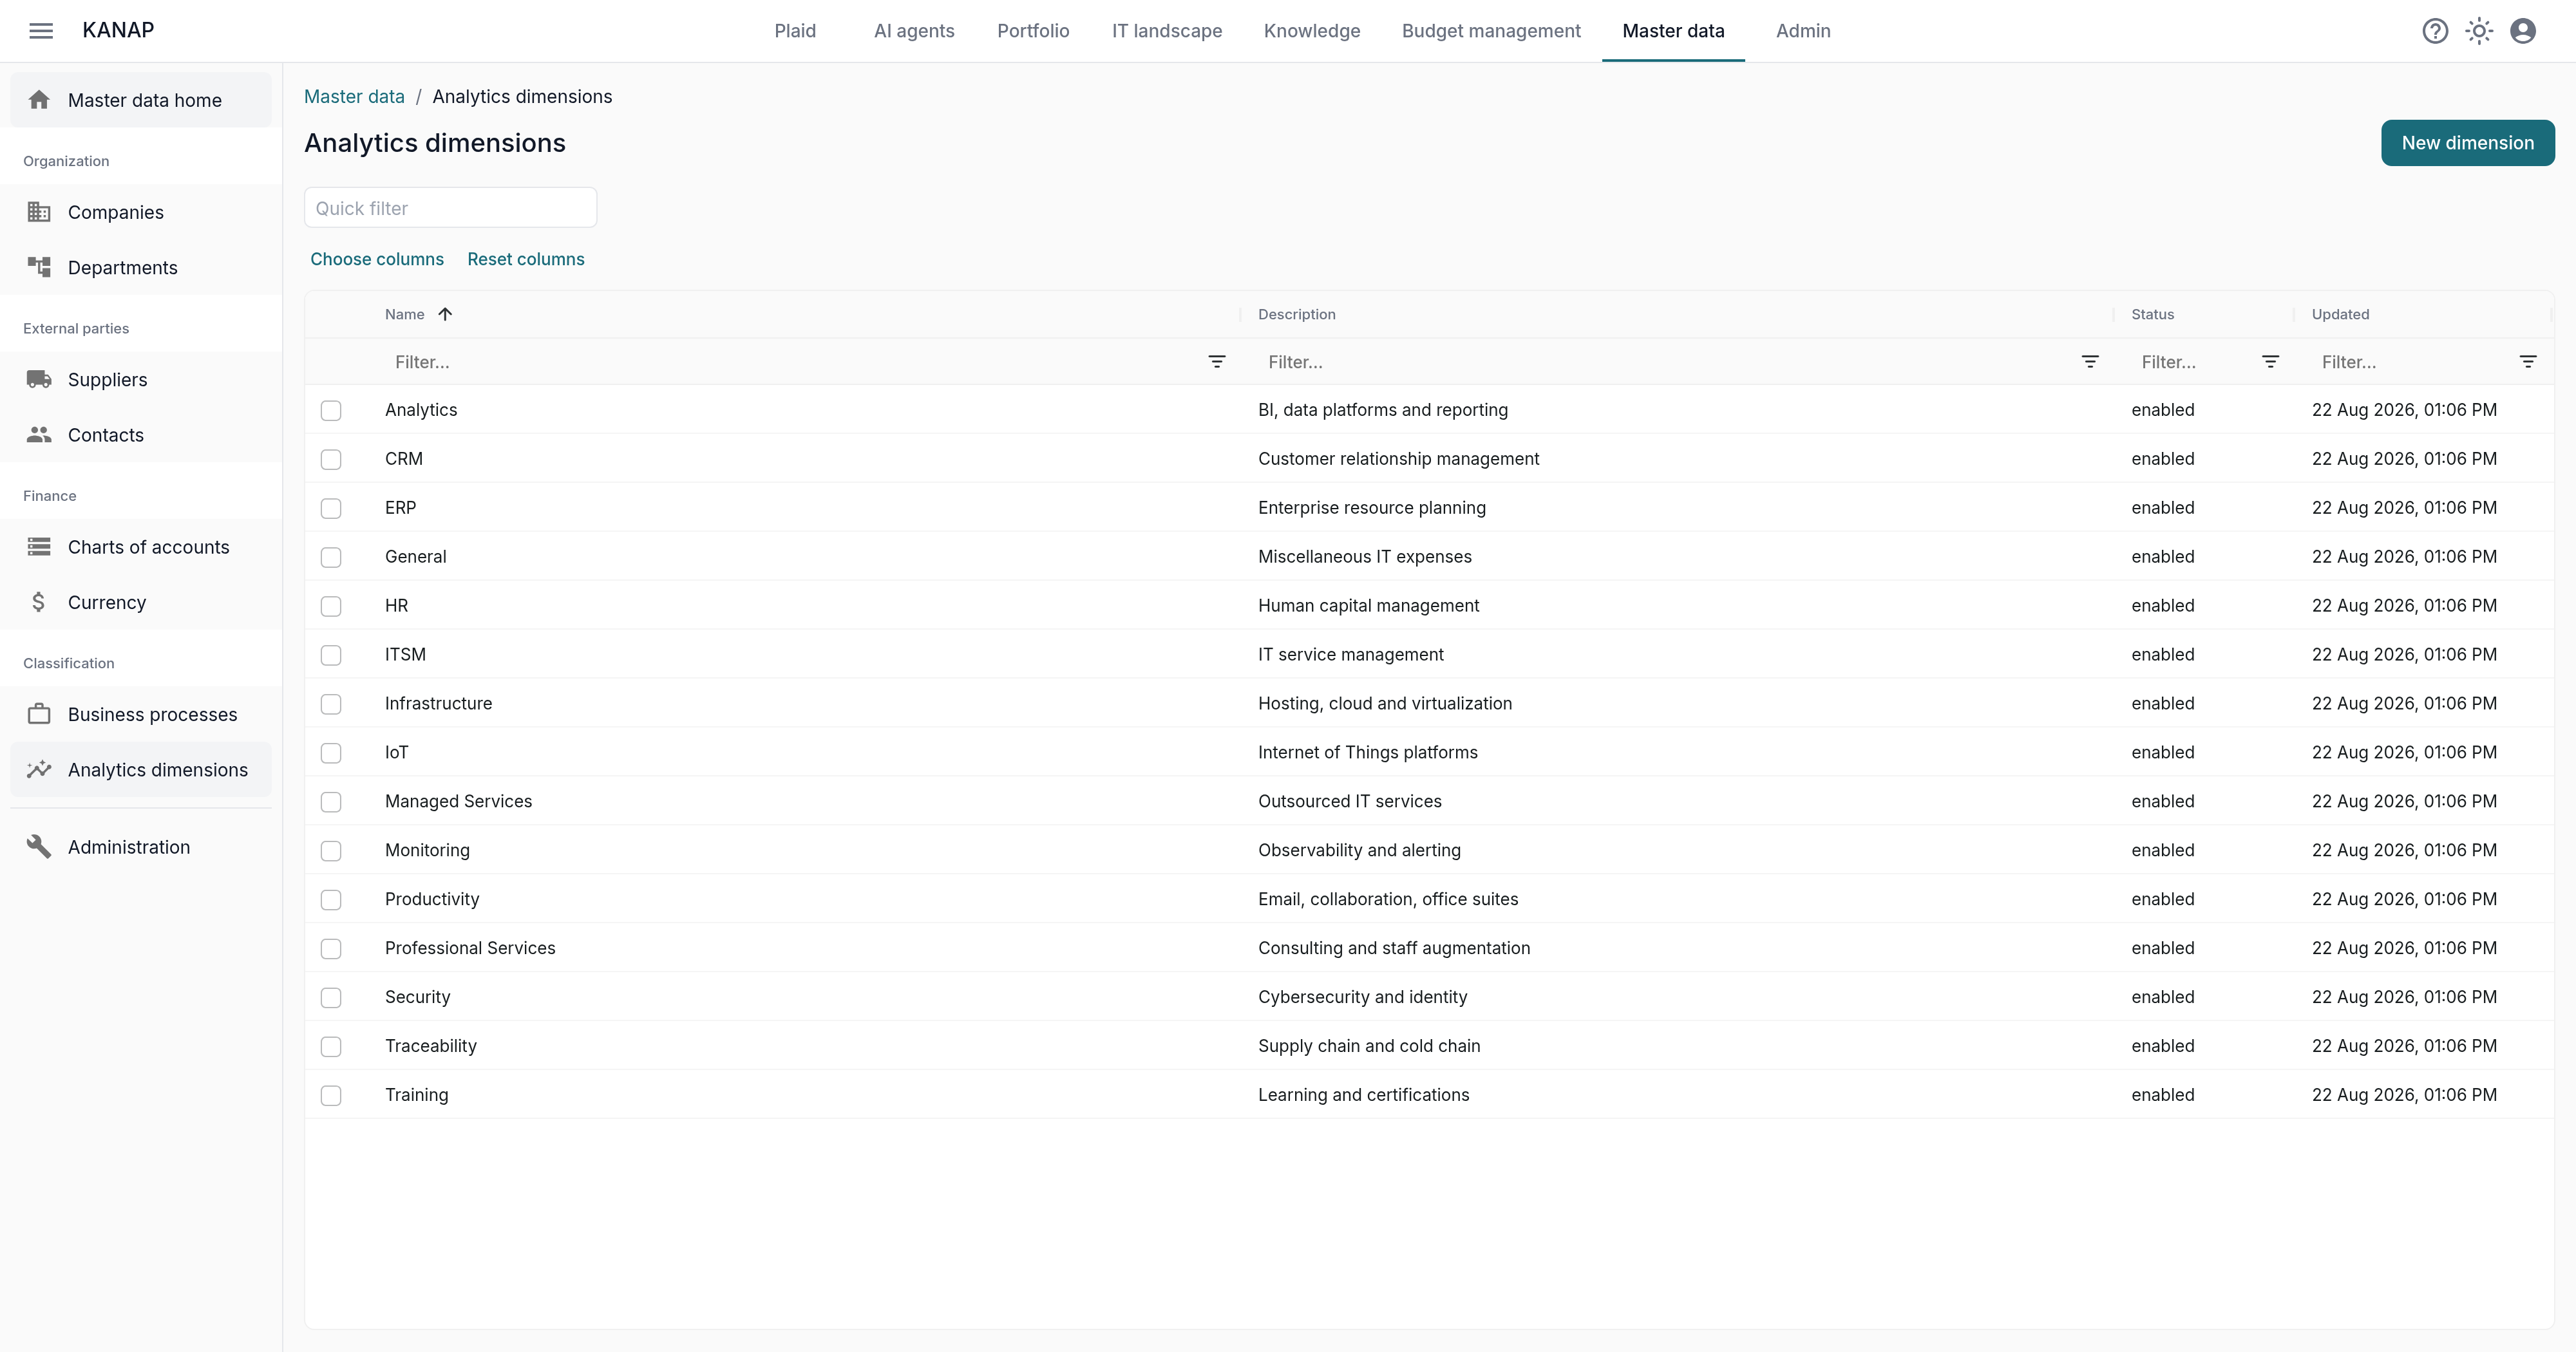
About ten broad categories are usually enough. Past twenty, you are describing your organisation instead of analysing it. Keep the naming consistent.
Tagging an item
In the properties panel of an OPEX or CAPEX item, the Analytics category field expects a dimension. Pick one, or leave it blank for “Unassigned”. The tag then applies to the whole item, across every fiscal year.
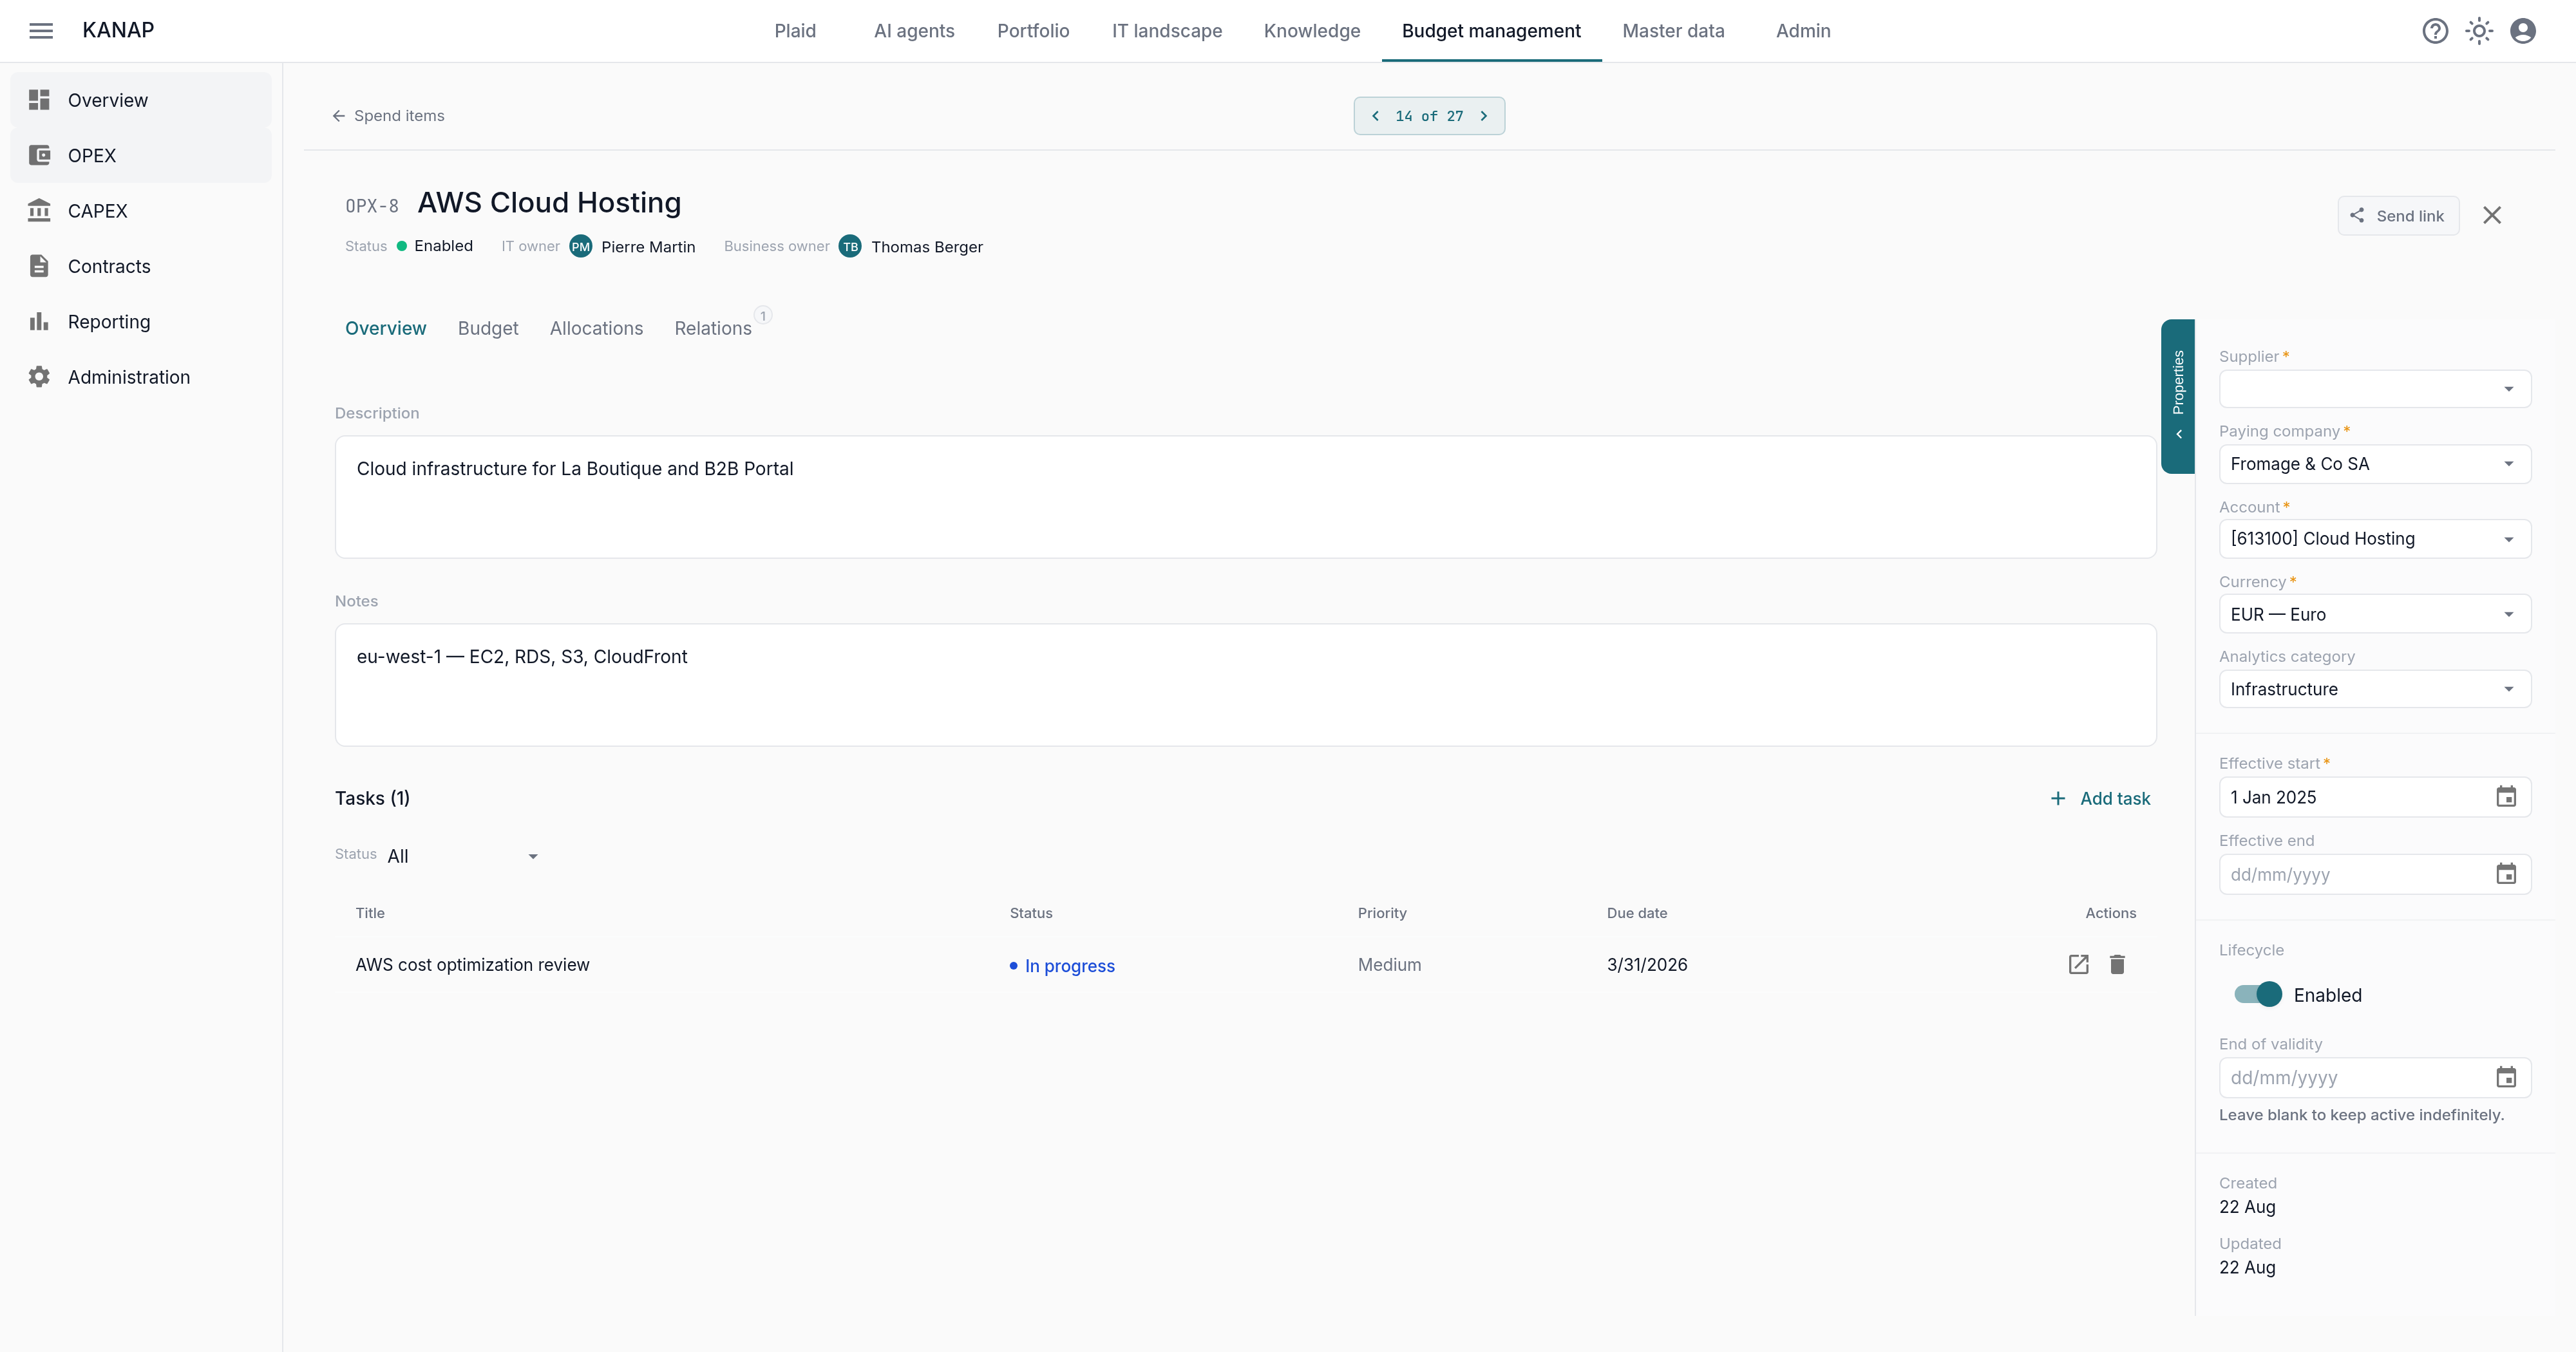
An item carries zero or one dimension. Multi-dimensional analysis is not available this way: to cross two angles, use departments and their allocation drivers.
Two points to keep in mind:
- No impact on allocations, and none on formal accounting. The paying company, the account and the allocation drivers do not move. Analytics dimensions are for reporting only.
- Departments and dimensions are not in the same league. Departments are formal organisational units with precise allocation drivers. Analytics dimensions are informal, optional tags with no allocation overhead.
To retire a dimension, disable it. The disabled date is recorded, the dimension disappears from selection lists, items already tagged keep their tag, and historical reports stay accurate. There is no delete button, and that is deliberate.
You can use the information gathered in the OPEX list by adding the optional “Analytics” column. It sweeps every item of a category at a glance: “Which applications does finance use?”.
The Budget by analytics dimension report
The report lives under Reports > Analytics dimensions.
- Single year: pie or horizontal bar chart, your choice.
- Multi-year range: a line chart, one line per dimension.
- Metric: budget, actuals, expected landing or revision.
- Dimension exclusion: to focus on a subset.
- Outputs: summary table, CSV export of the table, PNG of the chart, full PDF.
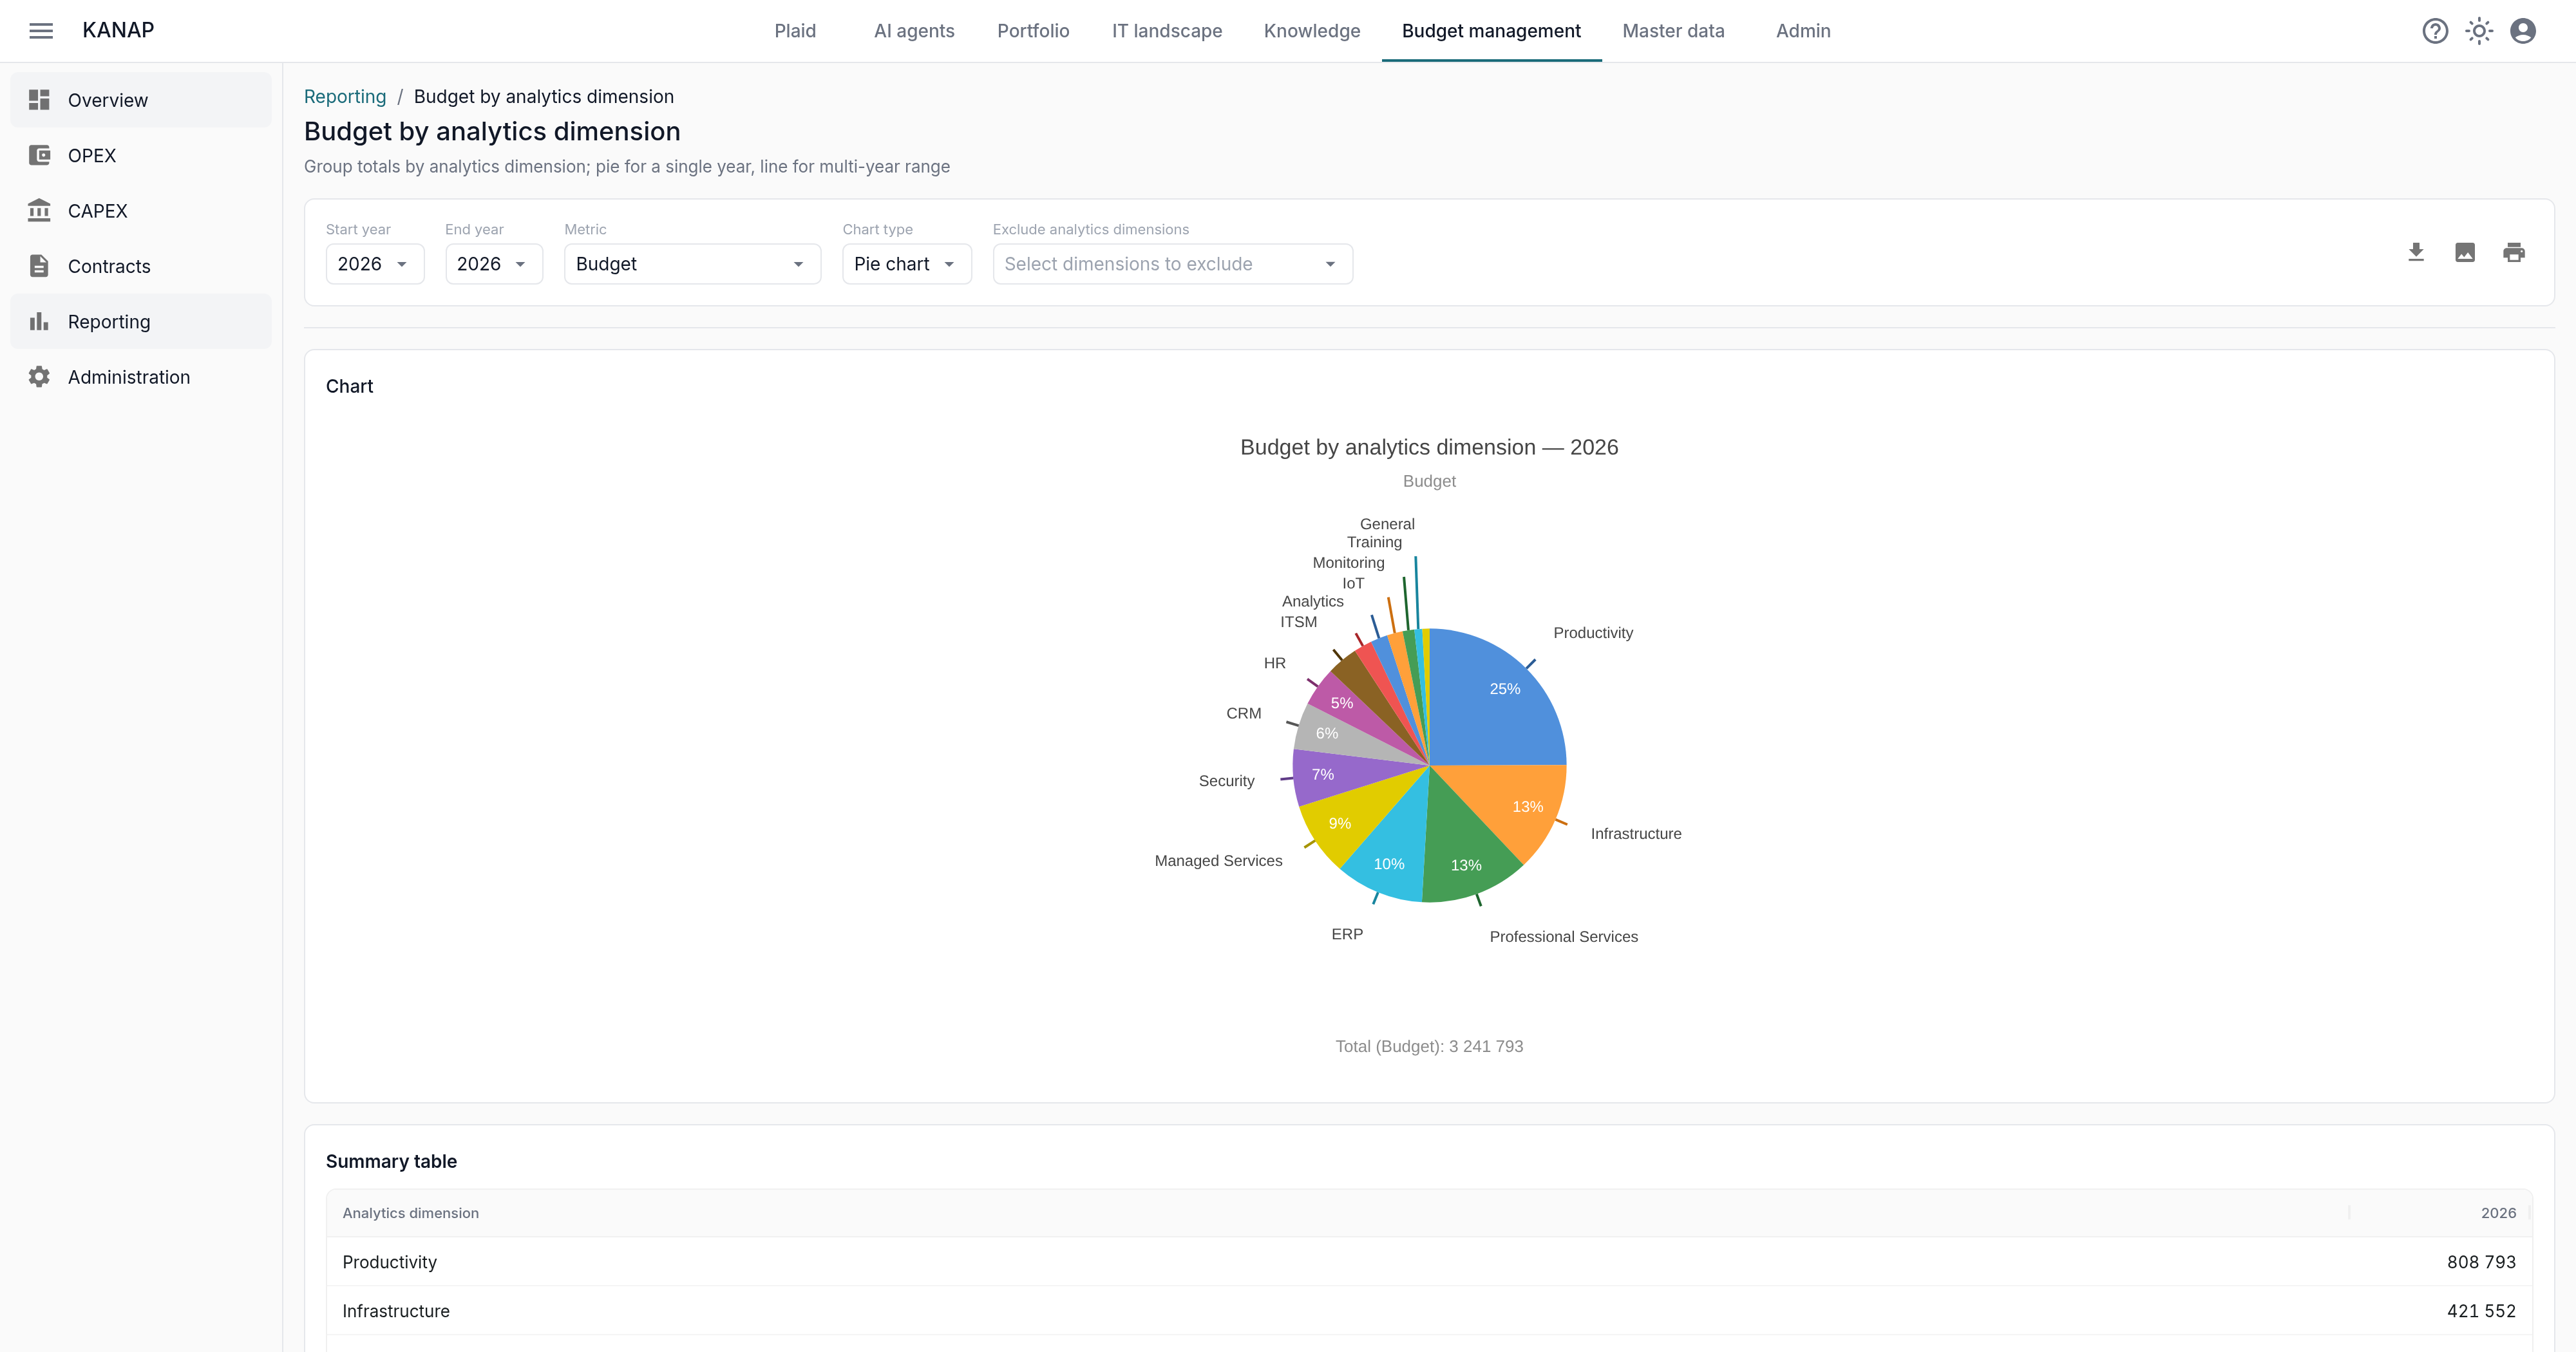
In the 2026 fiscal year, productivity alone takes 25% of the OPEX budget. Infrastructure follows at 13%, as do professional services.
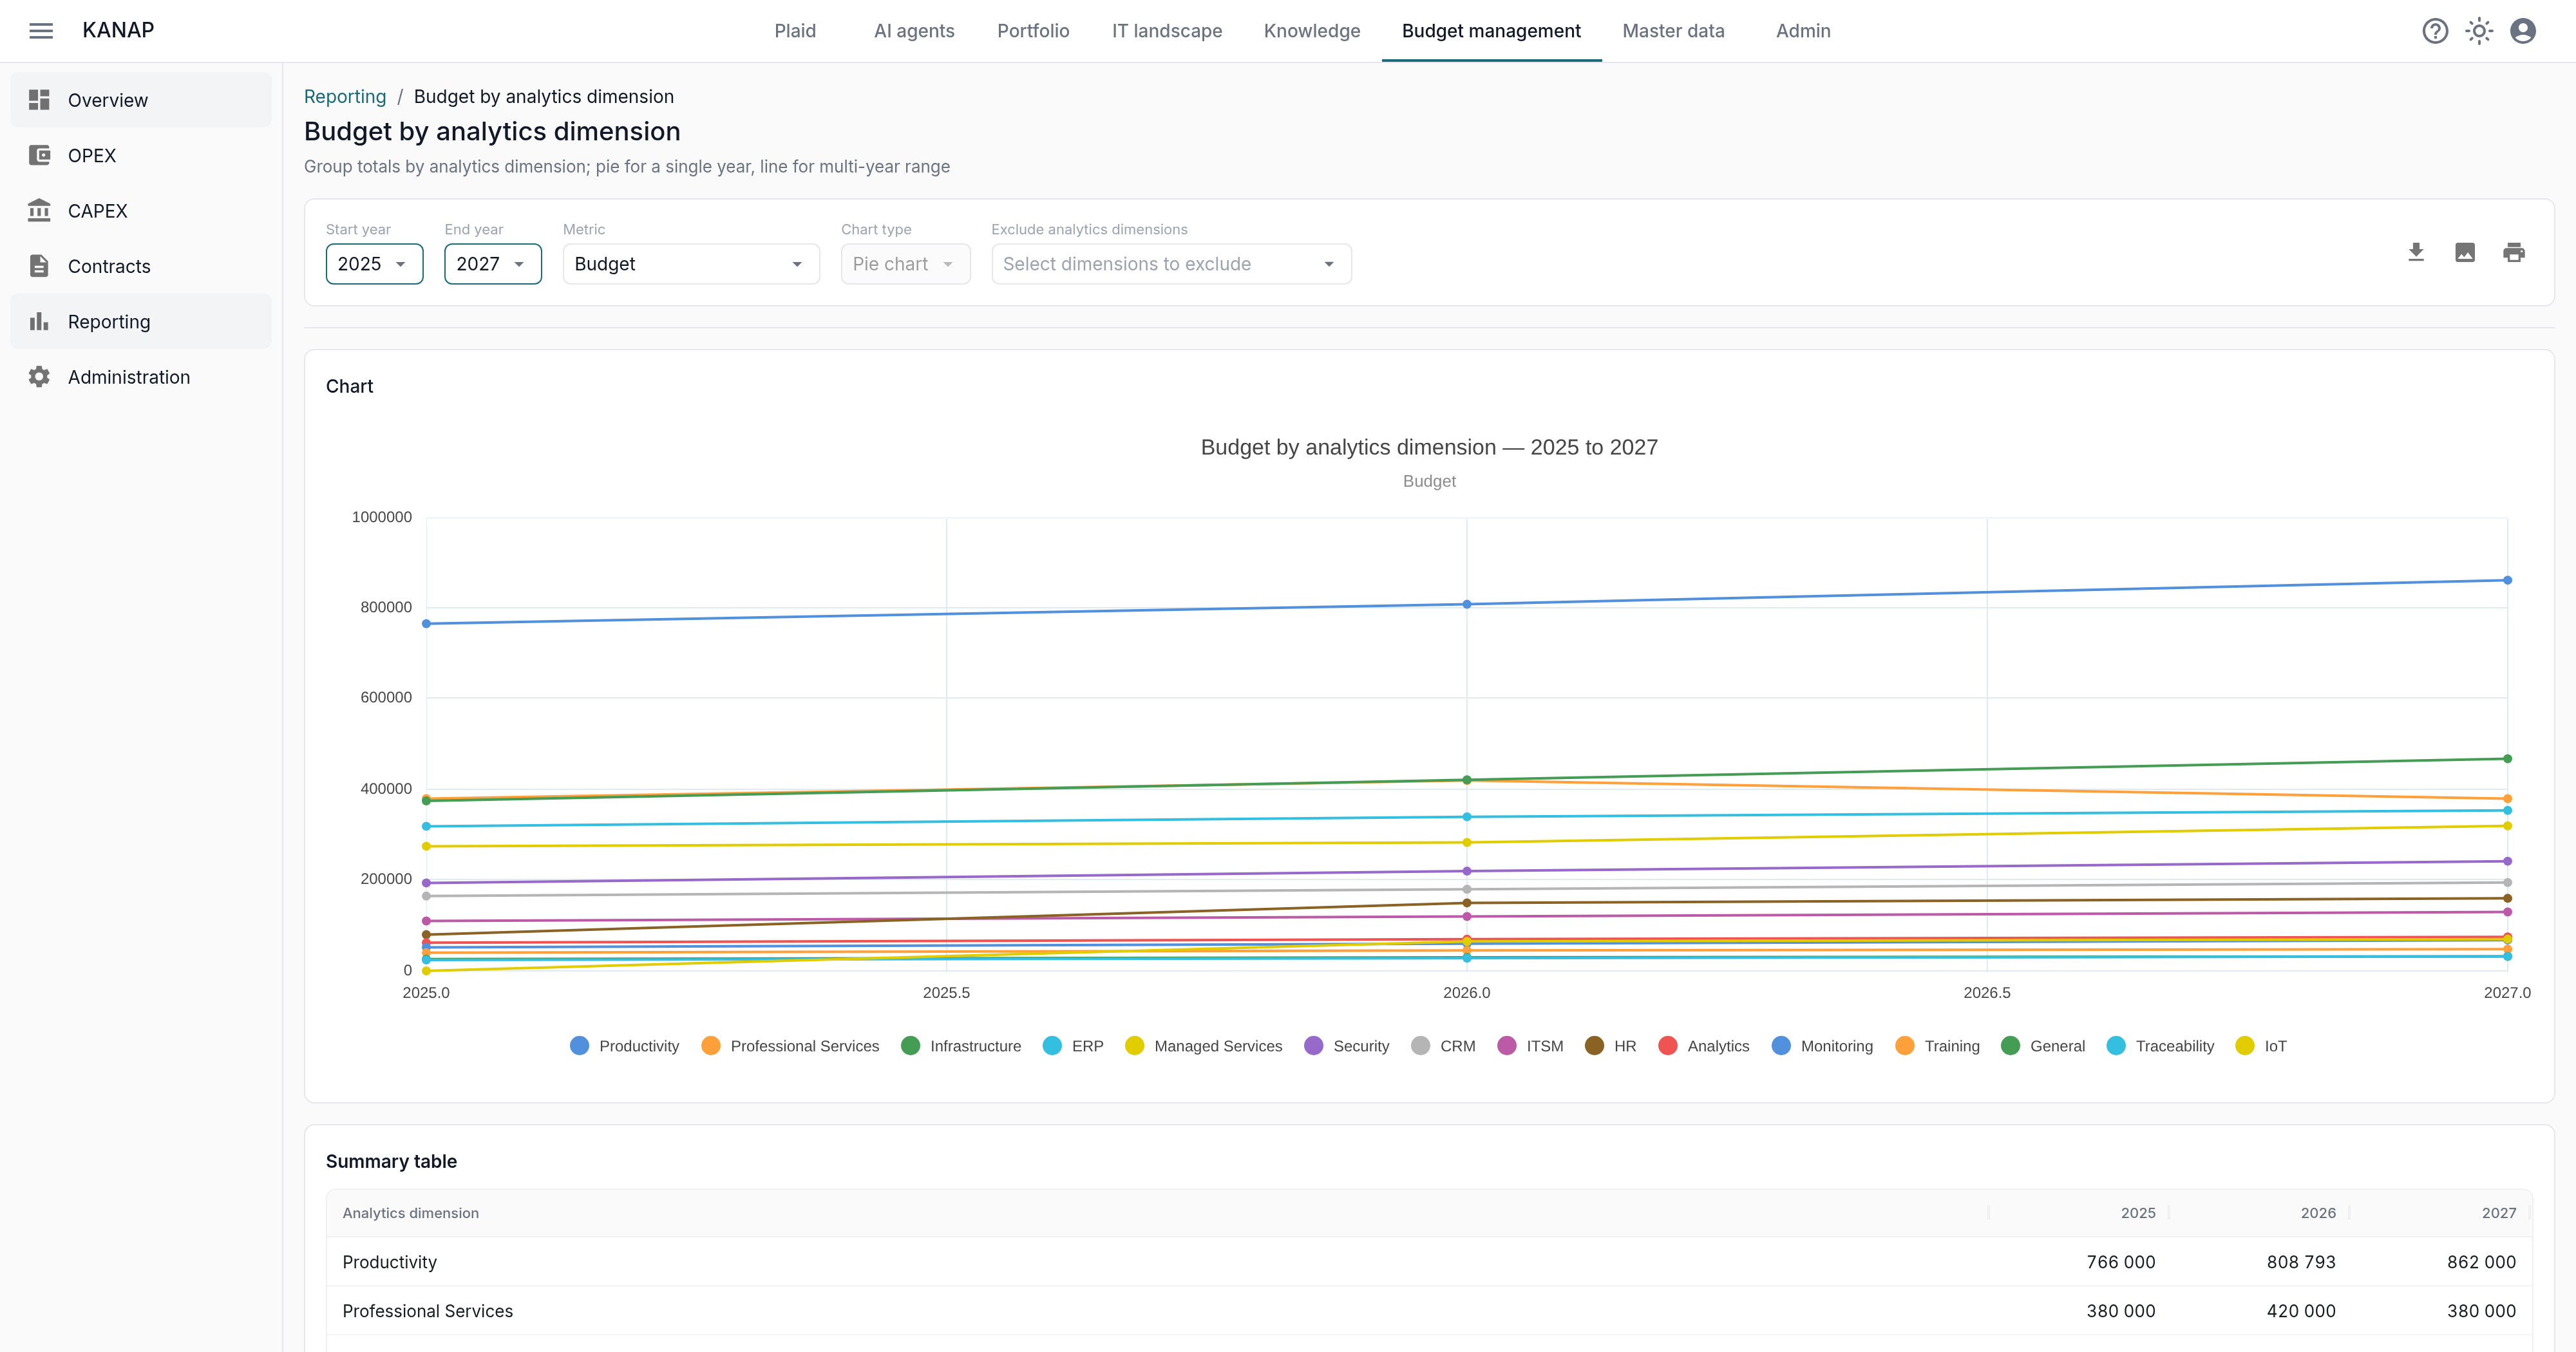
In the multi-year view, the report becomes a trend tool. One line takes off, another fades, and the decision is discussed on facts.
“Unassigned” is a valid state. Dimensions are optional, and an item without a tag simply shows up on that line.
Hidden costs
The pie surfaces what the item “top 10” hides. The dimension that grew too big to be honest. Two dimensions that describe almost the same thing and would be better merged. The line that starts at zero in 2025 on IoT, a trace of an item that appeared along the way. Or the HR dimension moving from 80,000 EUR to 150,000 EUR in one year, while the overall budget grows by 13%.
This is also where the two readings cross. Security accounts for 7% of the budget. The chargeback report says which subsidiary carries it. The CIO then holds a short, verifiable sentence in a budget review: here is what we spend, what for, and who pays.
What about CAPEX?
The Analytics category field also exists on CAPEX items, with the same rule: zero or one dimension. An investment project therefore reads with the vocabulary of recurring spend, and the two envelopes stay comparable.
That is the point of a shared nomenclature: the question “how much does security cost?” is asked the same way about a recurring licence and about an equipment project.
Where to start
- Create five to ten broad dimensions, each with a one-sentence description.
- Tag the ten heaviest items first. The report becomes useful at that step.
- Leave the rest as “Unassigned”, then tag as you go.
- Cross the report with the chargeback reports: who pays on one side, what for on the other.
- Re-run the report at every budget review. Split a dimension that is too broad, merge two that are too fine.
Analytics dimensions complement the allocation of IT costs (see IT cost chargeback, made easy) and give you the visibility you need to prepare, analyse and defend your budget.