
IT cost chargeback, made easy
Who pays what? How to share IT costs across companies and departments with clear rules, and how to use the chargeback reports.
“How much does IT cost us?” Easy question. “How much does IT cost department X?” Far less easy. And when management asks who should carry the bill, the CIO’s spreadsheet quickly shows its limits.
IT chargeback answers that question. Every IT cost is shared across the entities that benefit from it, following an explicit, verifiable rule. Those entities can be companies, departments, turnover, headcount, or simply a manual entry. And combinations of those criteria.
Costs can even be brought down to the per-user level for instructive comparisons across countries, departments and companies.
Why charge back, even without an internal invoice
Charging back does not necessarily mean issuing an invoice. The first goal is to make the cost visible. A CIO who can show that one subsidiary’s IT costs are two or three times higher than another’s will be better armed when justifying a change of strategy.
Three uses come up again and again:
- Accountability: each entity sees what its choices cost.
- Justification: a budget defended with per-entity figures offers far more visibility than a single consolidated amount.
- Arbitration: comparing IT cost per user across companies brings out the gaps.
Defining the allocation rules
The default rule
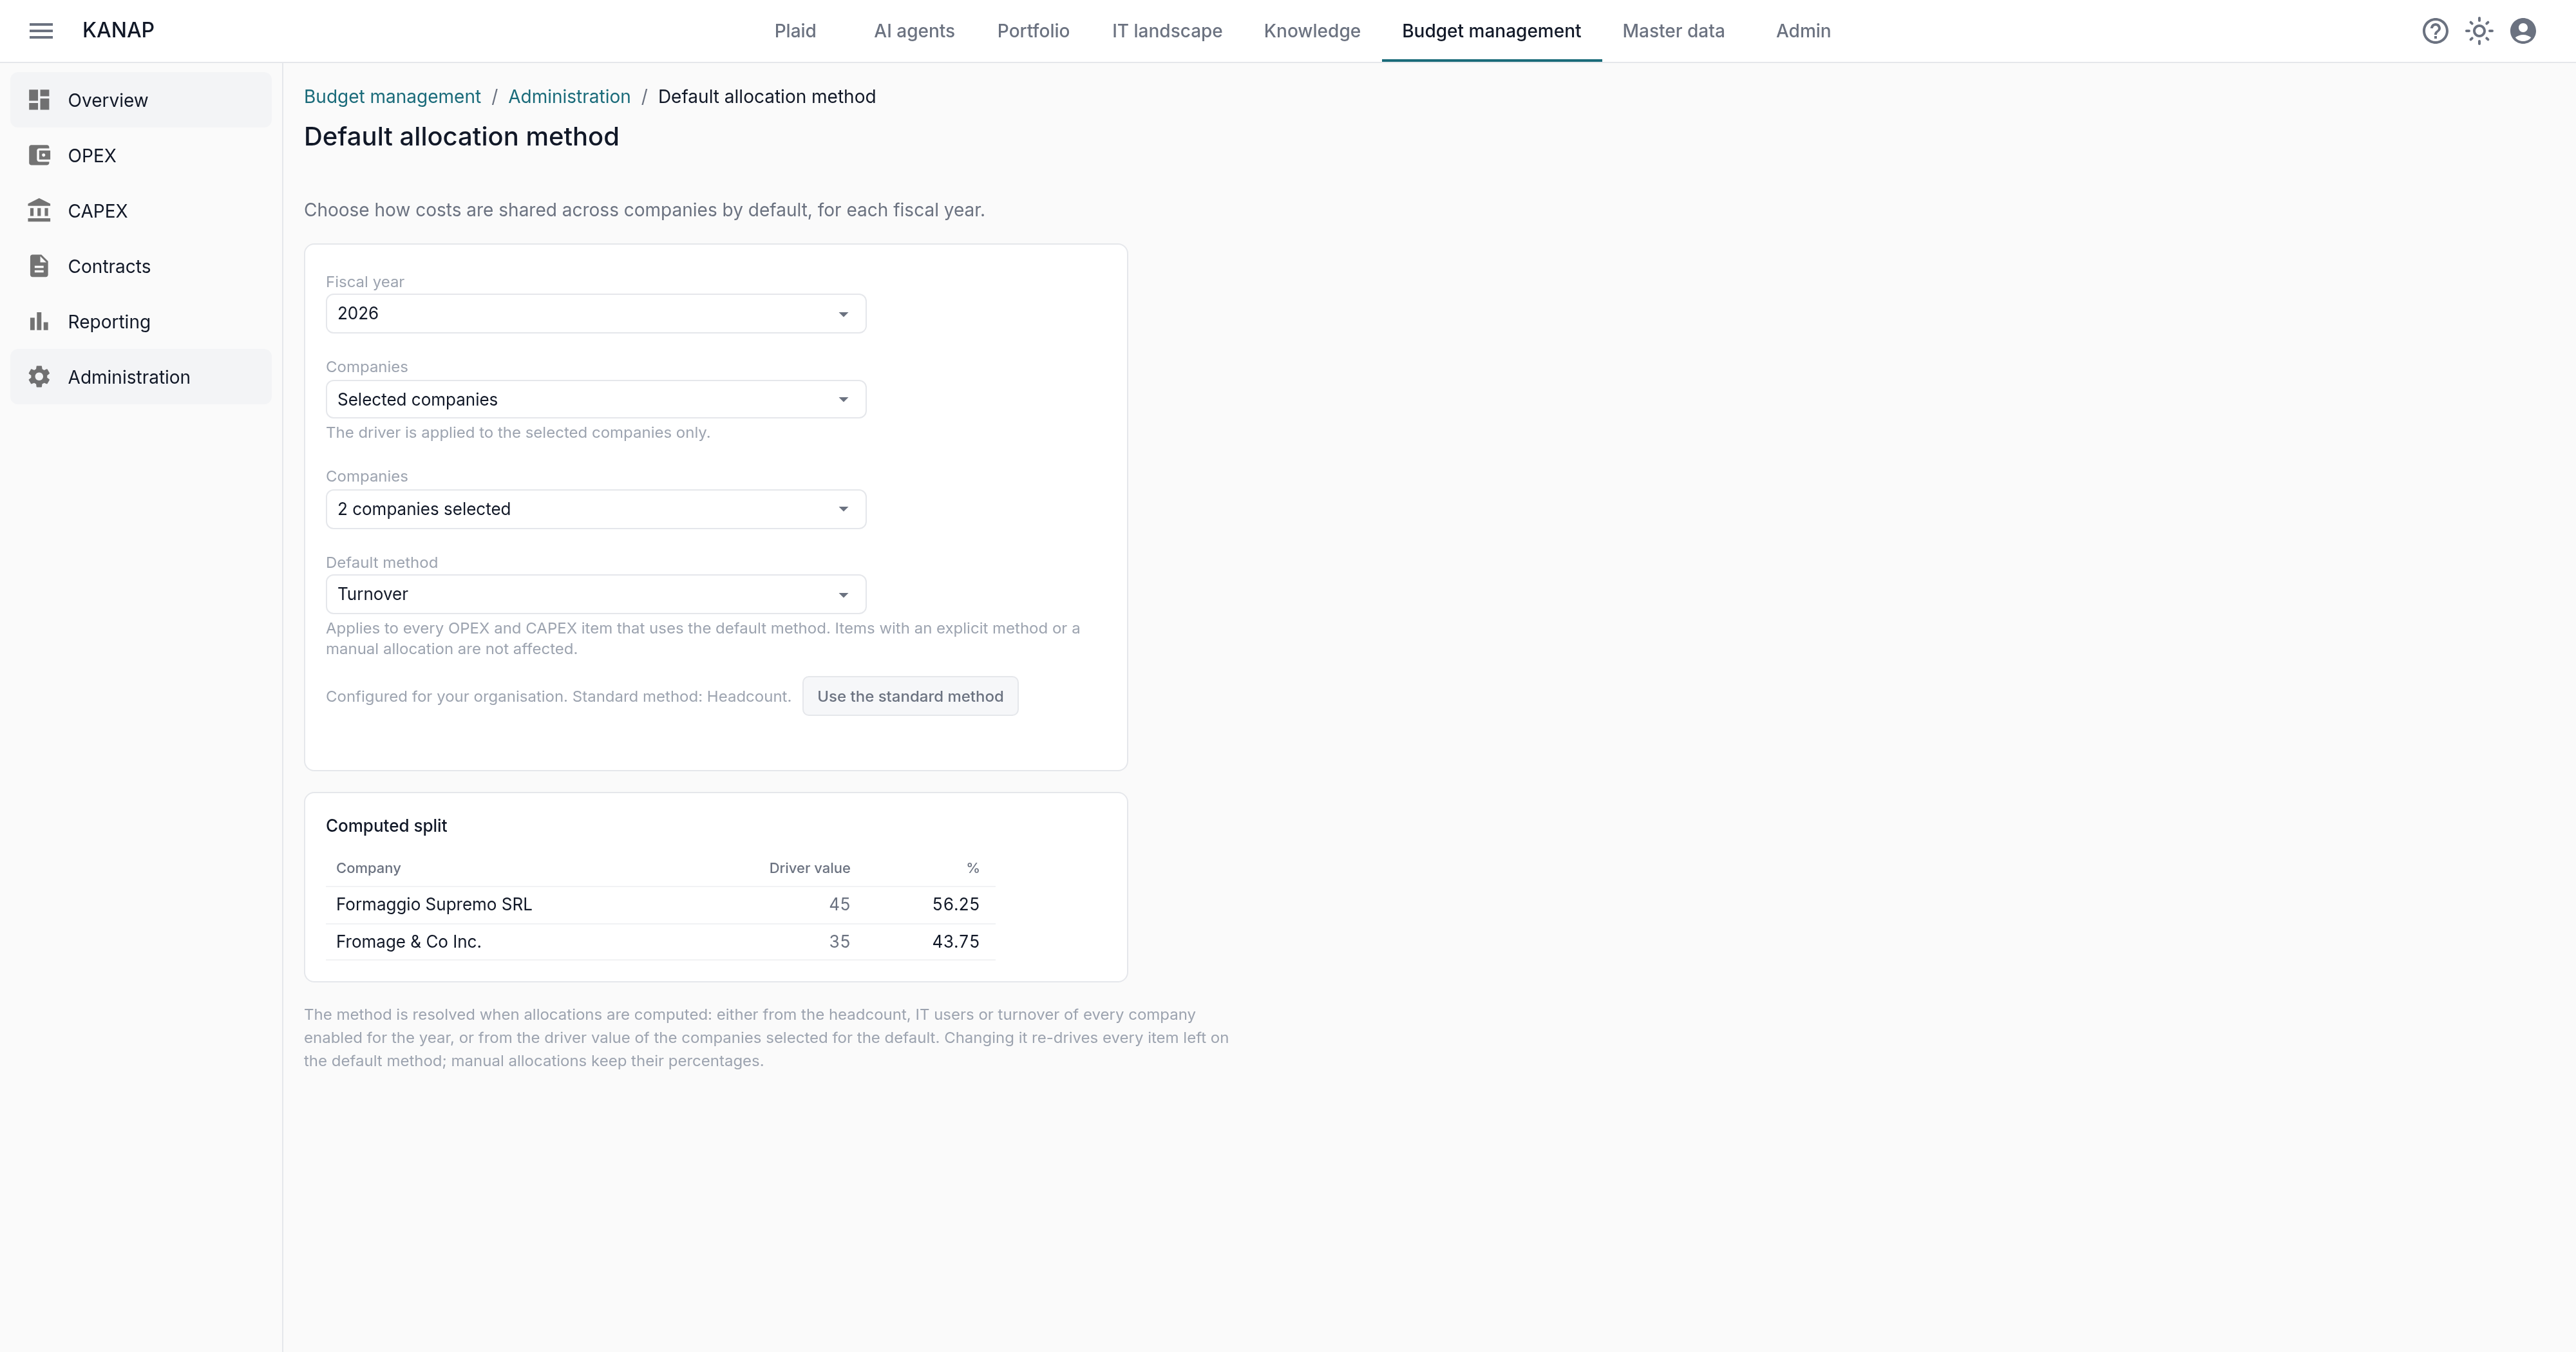
By default, KANAP uses the headcount of the companies defined in the reference data: all costs are shared across all companies based on headcount.
You can change this default rule in Administration, Default allocation method. The rule you set applies year by year to entries that have not been customised yet (you do not lose work already done).
Managing rules per item
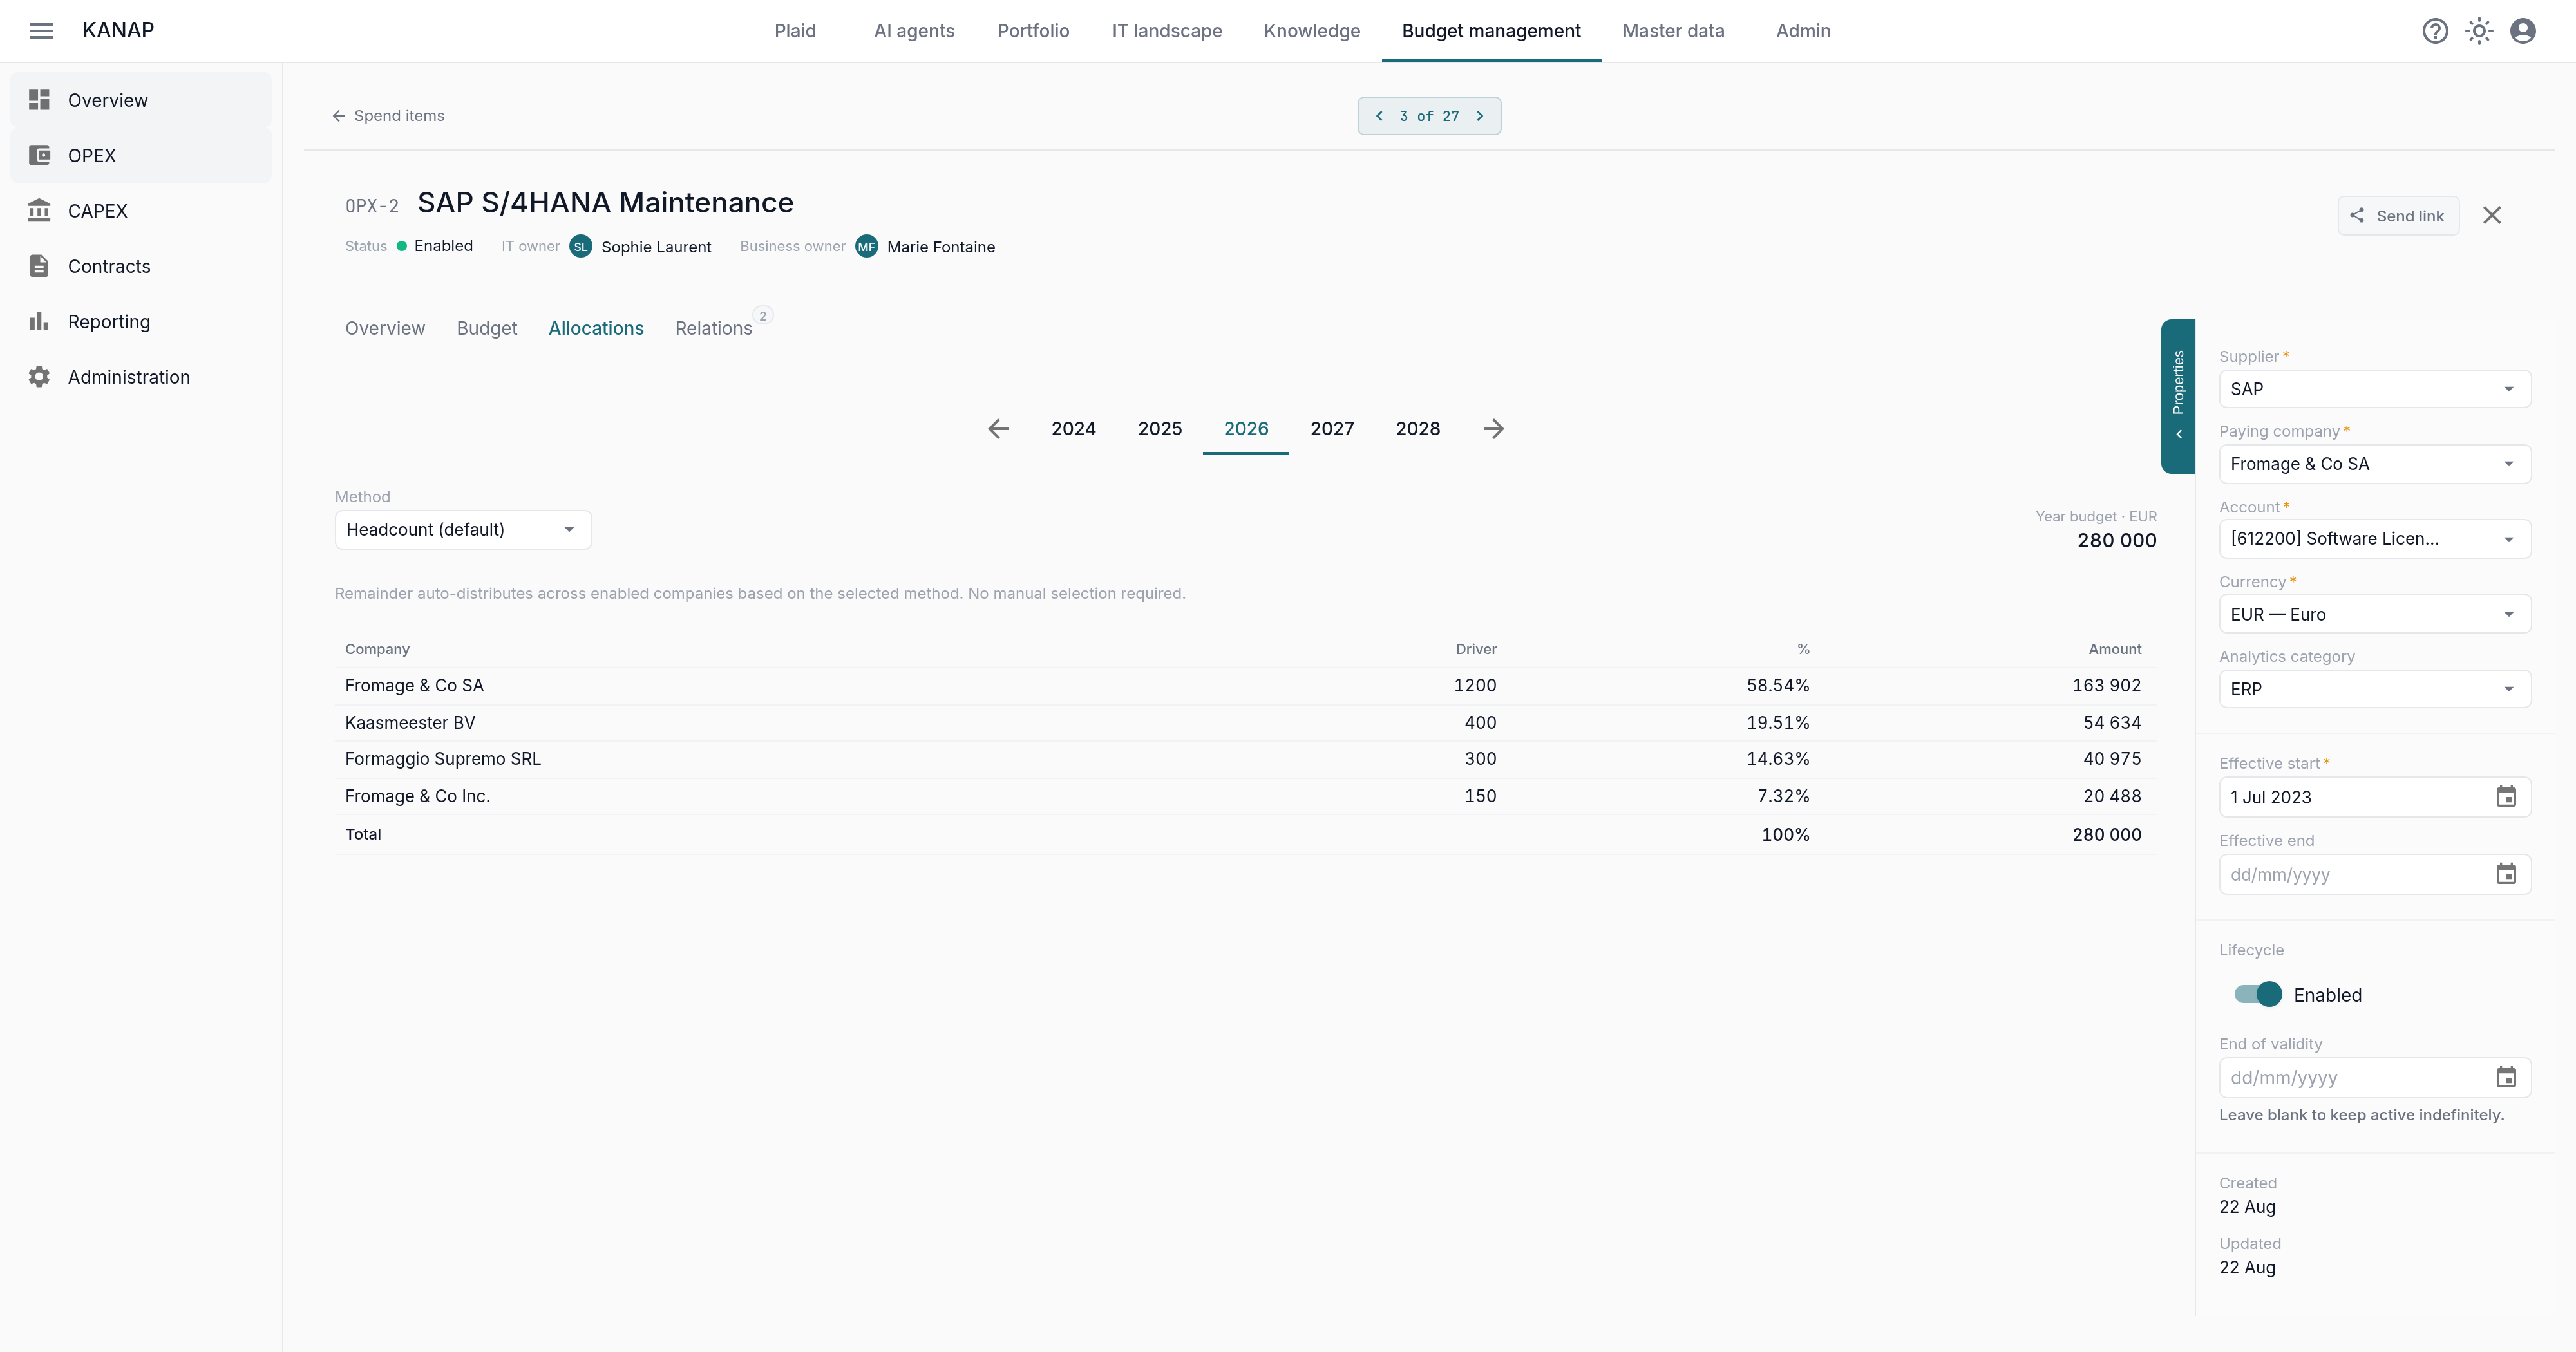
Each spend item carries its own allocation rule, for each year. When the default setting needs refining, it can be adjusted for each OPEX and CAPEX entry. That is what lets you route the cost of specific applications correctly (for example, an accounting package charged to the finance department).
An item’s Allocations tab shows the result in real time. Here, the 280,000 EUR SAP maintenance is split by headcount: 58.54% for Fromage & Co SA, 19.51% for Kaasmeester BV, and so on up to 100%.
Every allocation basis is available:
- Headcount (default): the most common basis, fed by the companies’ annual headcount.
- IT users: for costs that follow the number of equipped workstations per company (useful for groups where many employees are not, or barely, IT users).
- Turnover: when the contribution follows the entity’s economic size.
- Manual by company: to allocate costs to one or more specific companies (still by headcount, IT user count or turnover).
- Manual by department: to allocate costs to one or more specific departments, by headcount only.
- Manual: for complete freedom of allocation, but you calculate the percentages yourself.
To avoid reconfiguring everything every year, the “Copy allocations” tool rolls these rules from one fiscal year to the next, dry run included. Allocation therefore follows the budget with no retyping.
The chargeback reports
Once the rules are in place, two reports let you explore every facet of chargeback.
Global chargeback
The first answers “how is IT spend shared across our companies?”. It shows the consolidated total, each company’s share, amounts paid and consumed, then intercompany flows.
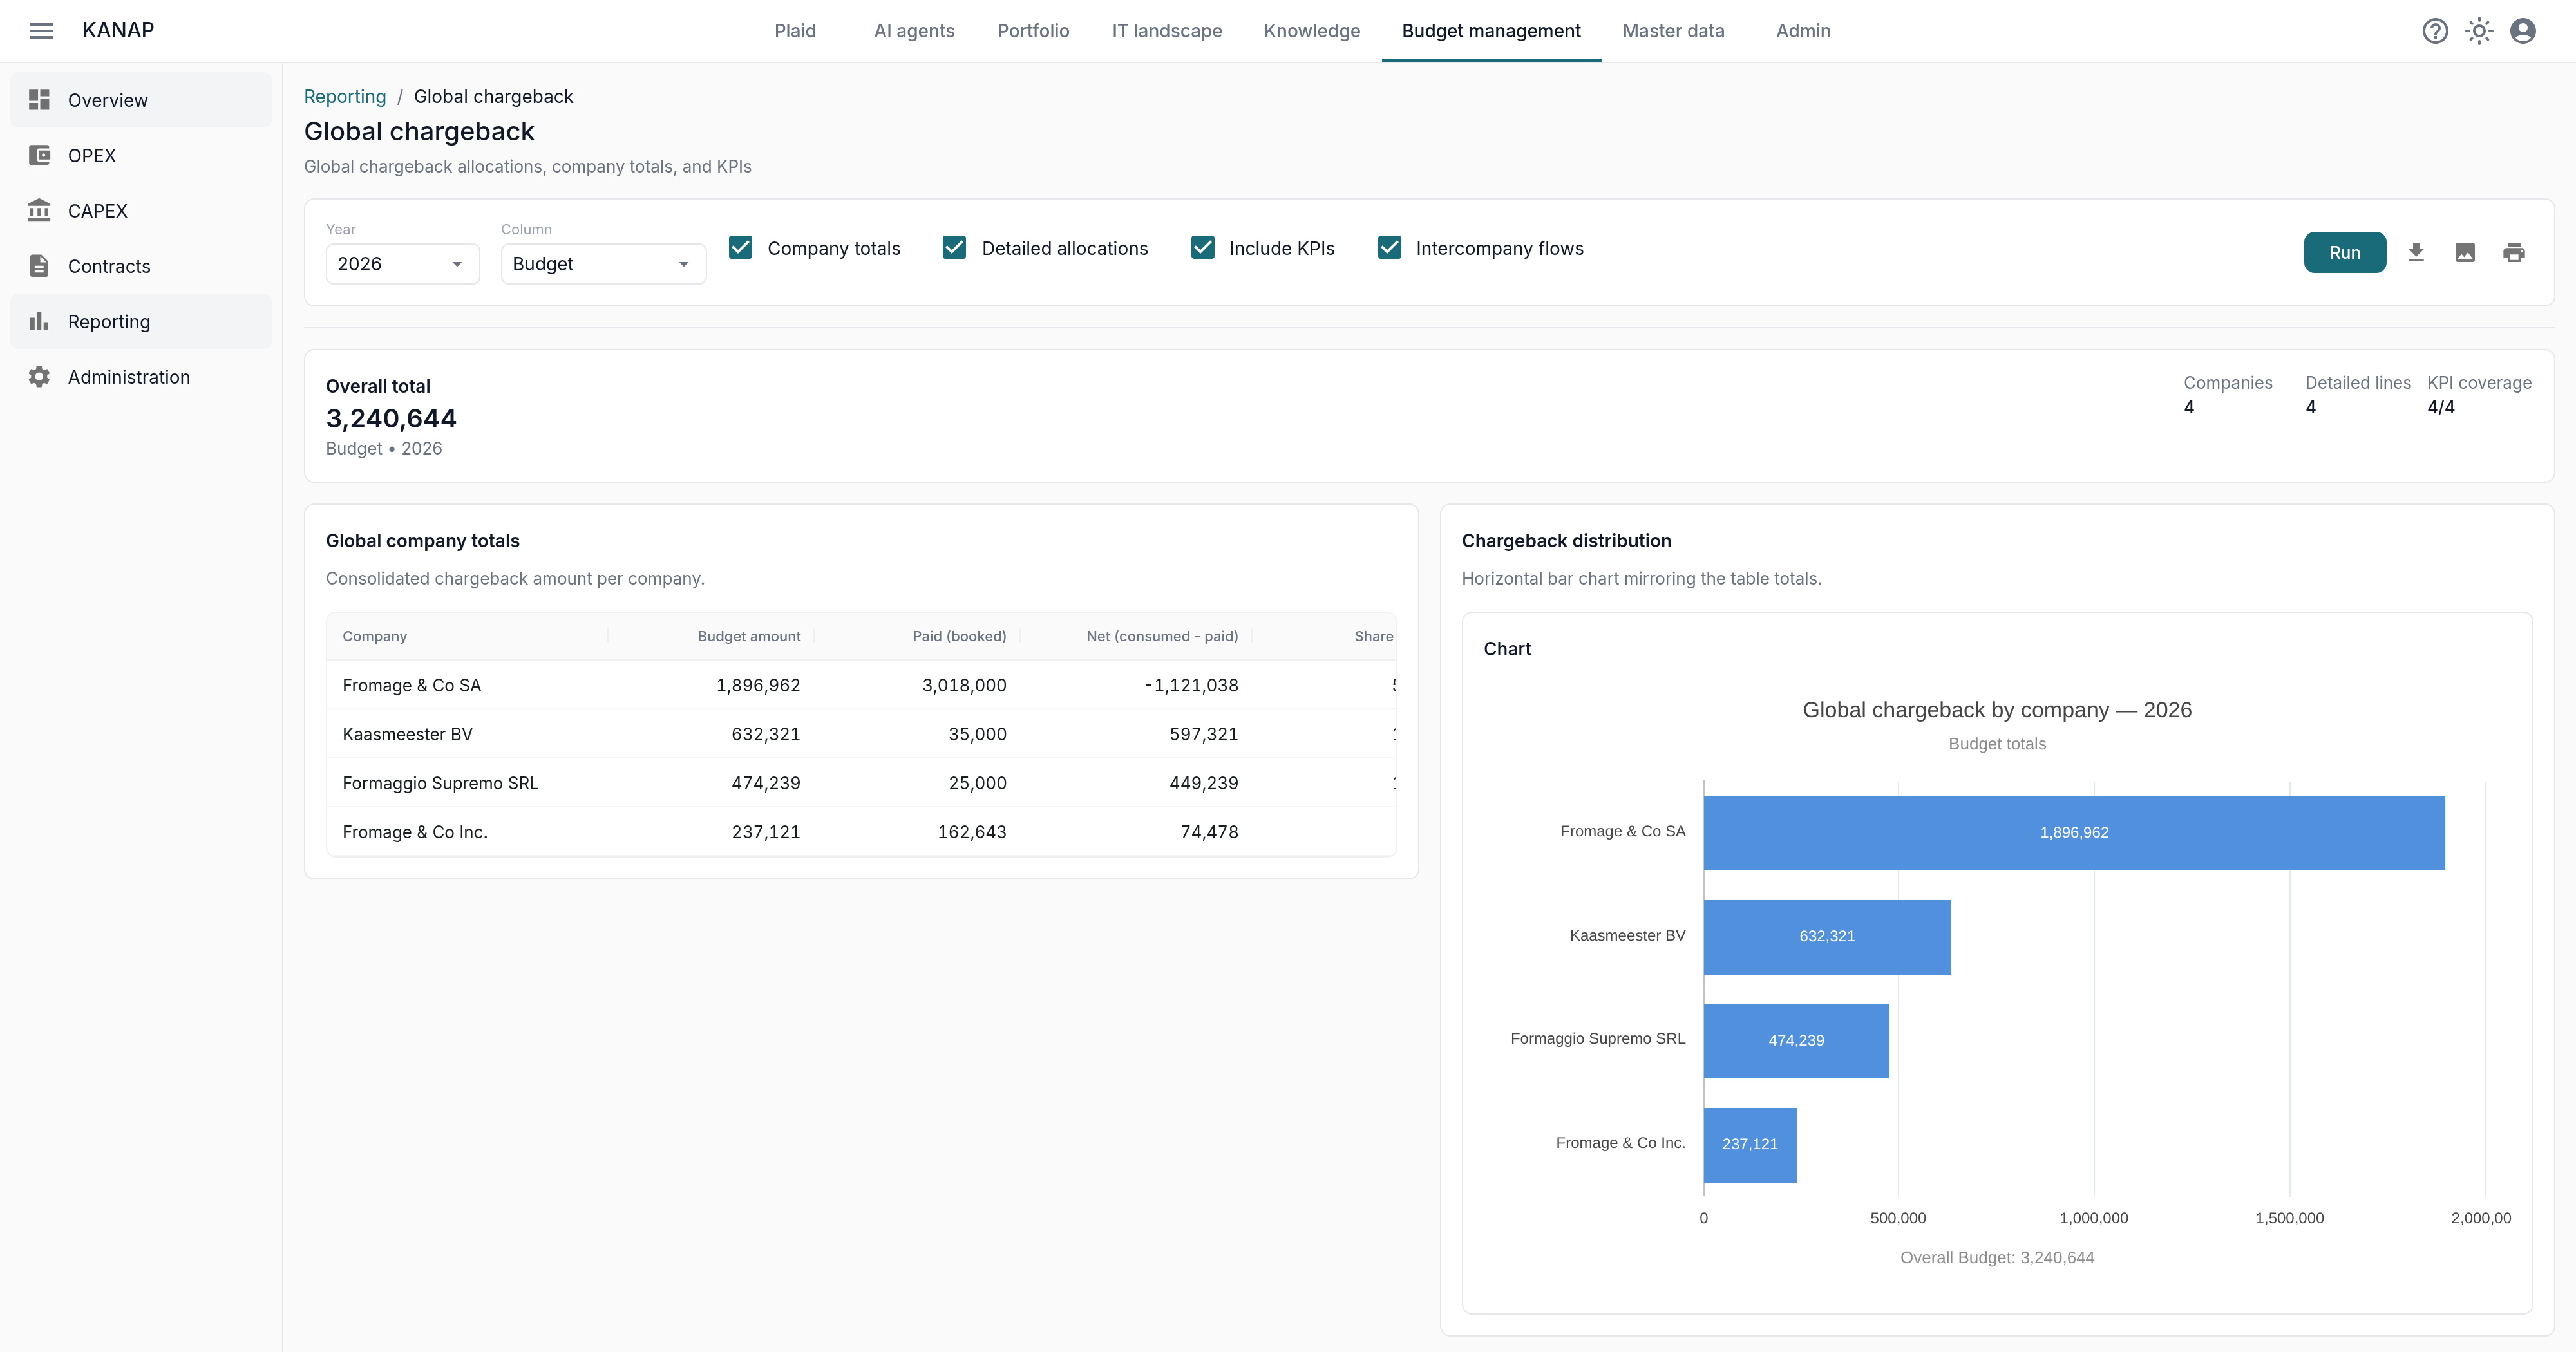
The KPIs add two metrics that are key to any IT budget:
- IT costs vs. turnover, for the group as a whole and per company. You can then say, with evidence: our IT costs 2.45% of turnover per year.
- IT costs per person and per IT user, in absolute value.
Company chargeback
This report goes one level deeper and analyses the detail for a single company. It shows IT costs per department, the chargeback items (to answer a subsidiary: here is exactly what you are billed for), the detail of inbound and outbound flows, and a recall of the KPIs. This is the report to send to subsidiaries with their annual invoice.
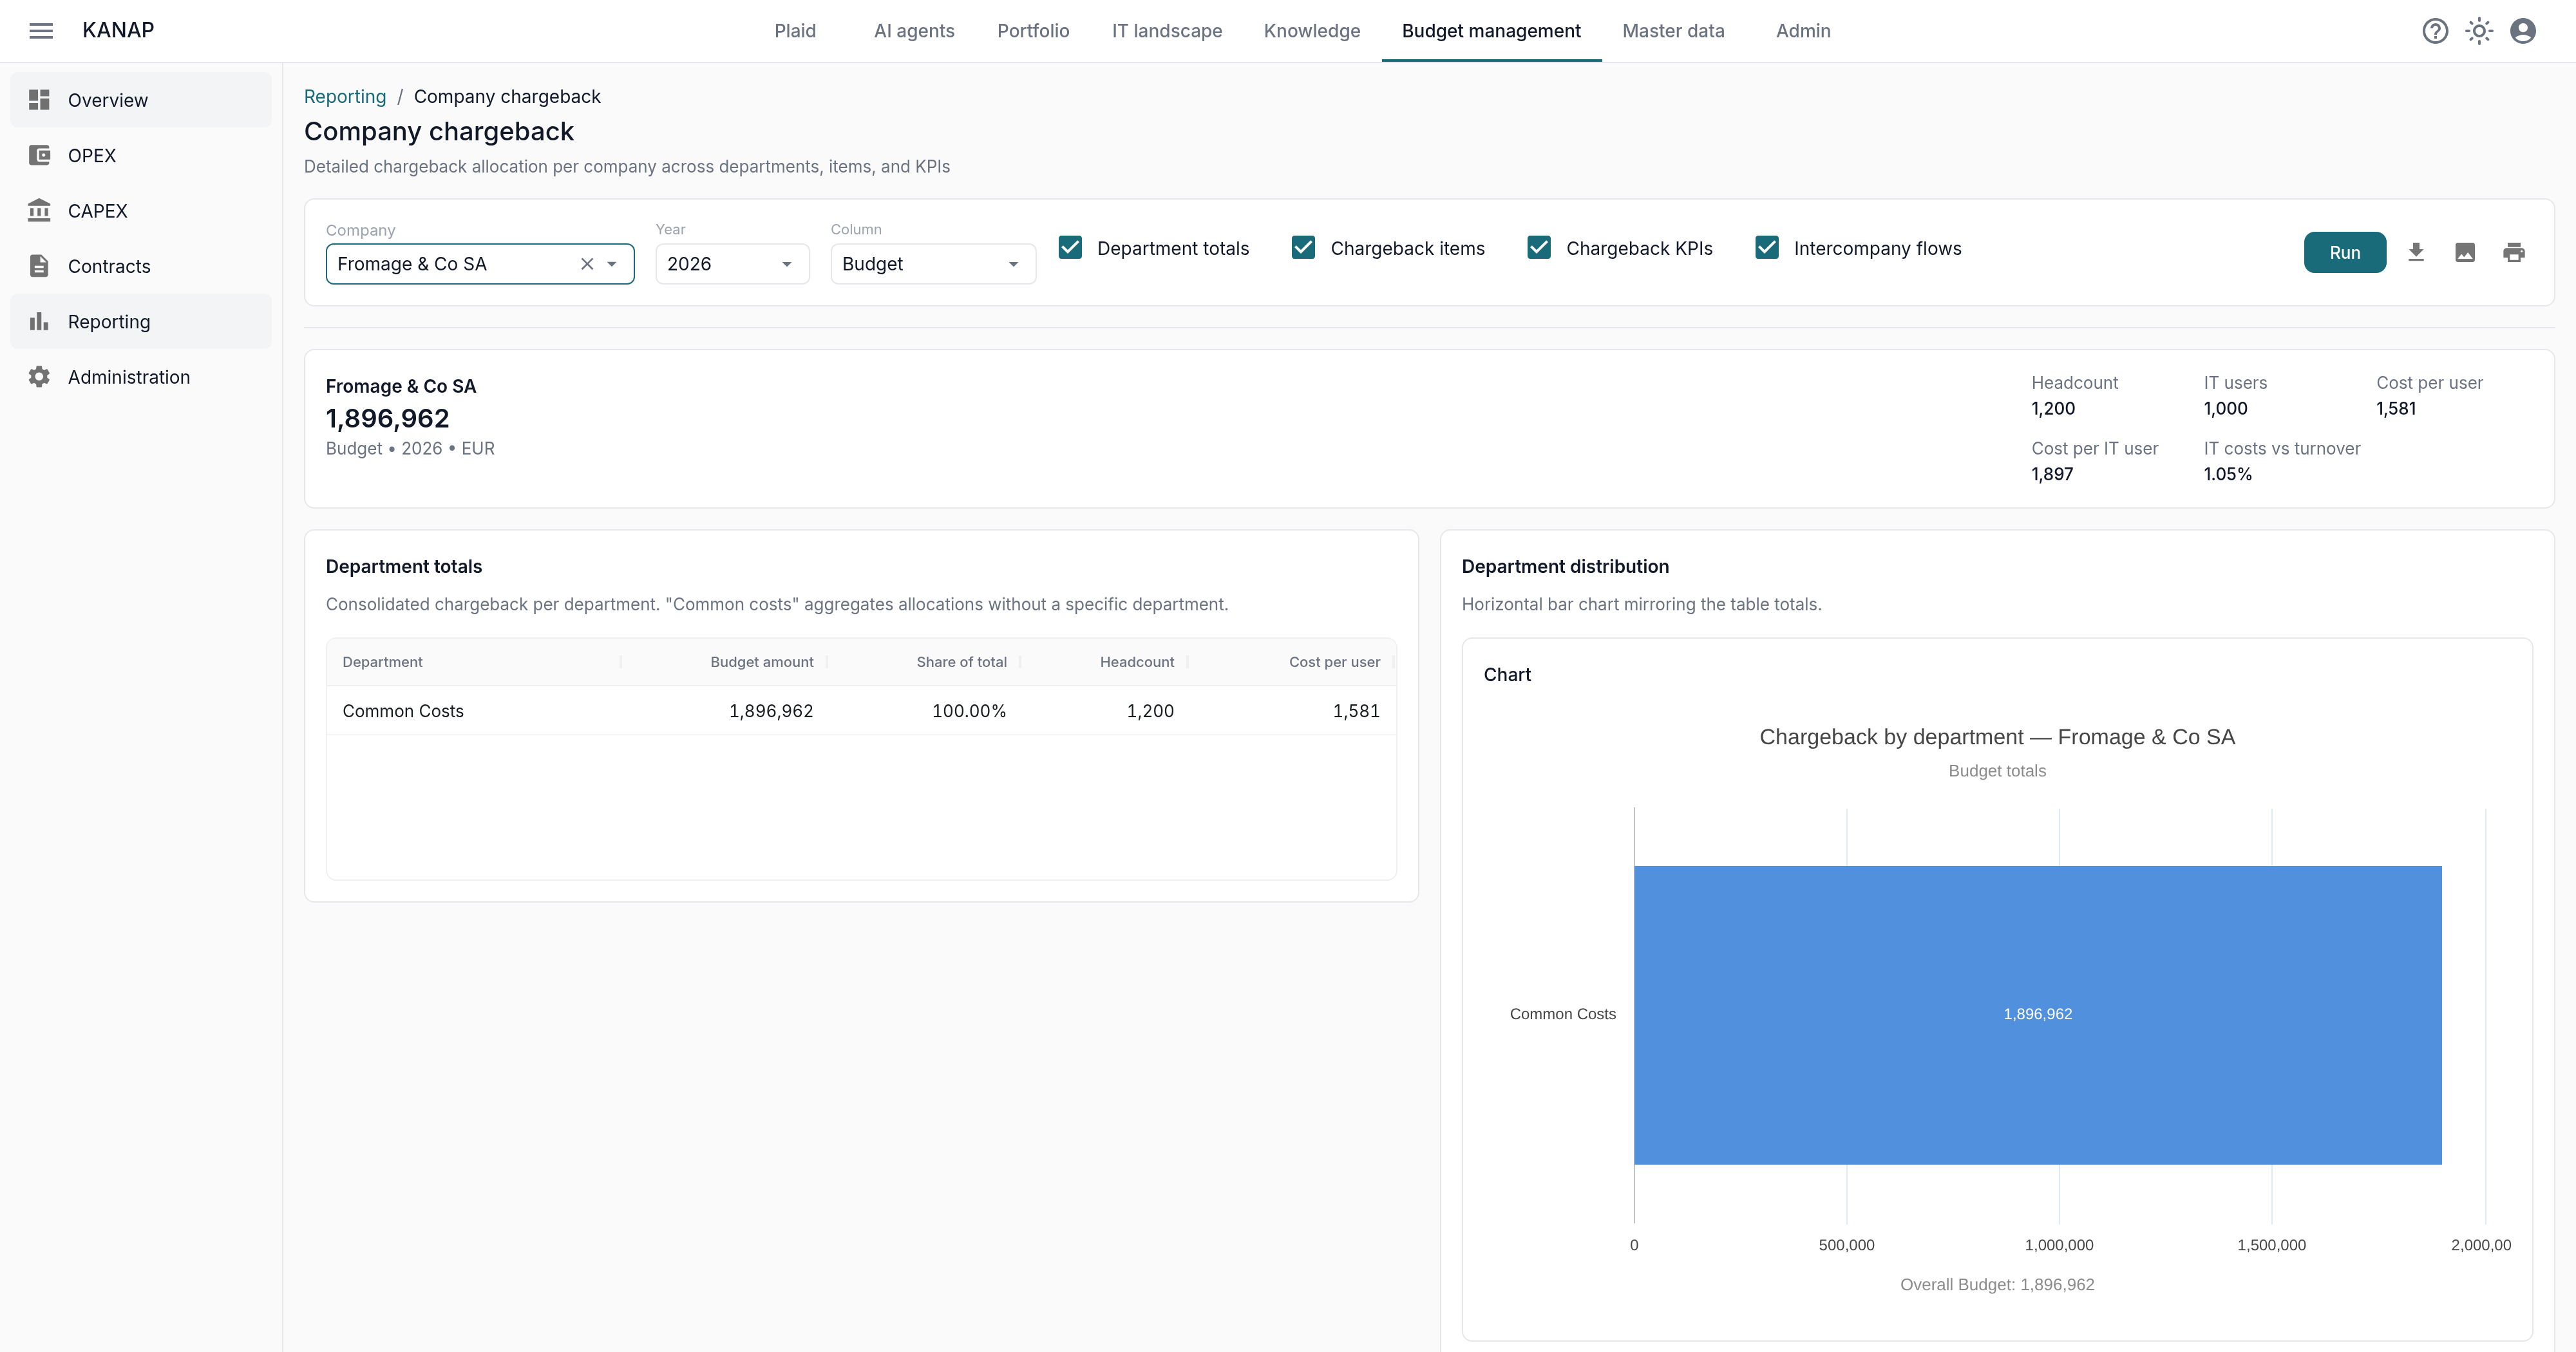
Both reports are fully parameterisable (year, company, sections) and export to CSV, PNG or PDF. They can also be presented directly in a budget review.
Hidden costs
These reports often surface lines or situations that the big budget “top 10” hides. The 15k EUR tool used by three people that sends a department’s cost per user through the roof. The application charged back to a subsidiary that already pays for an equivalent package. The gaps in cost per user between companies or departments.
This is often where serious savings opportunities lie, and it is how the CIO can score points with general and financial management.
What about CAPEX?
Investments use the same Allocations tab and the same mechanics. A project funded for a single subsidiary is allocated to that subsidiary; the rest follows the chosen method. The chargeback reports cover both envelopes, OPEX and CAPEX.
Where to start
- Check the company metrics for the current year: headcount, IT users, turnover. This is the reference data behind chargeback.
- Set the default method that suits your environment, then handle only the special cases.
- Choose the level of granularity you want when reviewing special cases, then stay consistent throughout.