
Budget, part 3 - The presentation
The budget is ready, now it has to be sold. KANAP surfaces the key figures, offers ready-made reports and answers the 'who pays what'.
The budget is built; it still has to be approved. KANAP makes the presentation easier with configurable reports that show the different facets of the budget in a visual, pragmatic way. Once the budget is approved, KANAP locks the columns involved so nothing moves afterwards.
Ready-made reports
The Reporting section offers nine preconfigured reports, each with a summary table, a chart and exports. Nothing to build: you choose, you run.
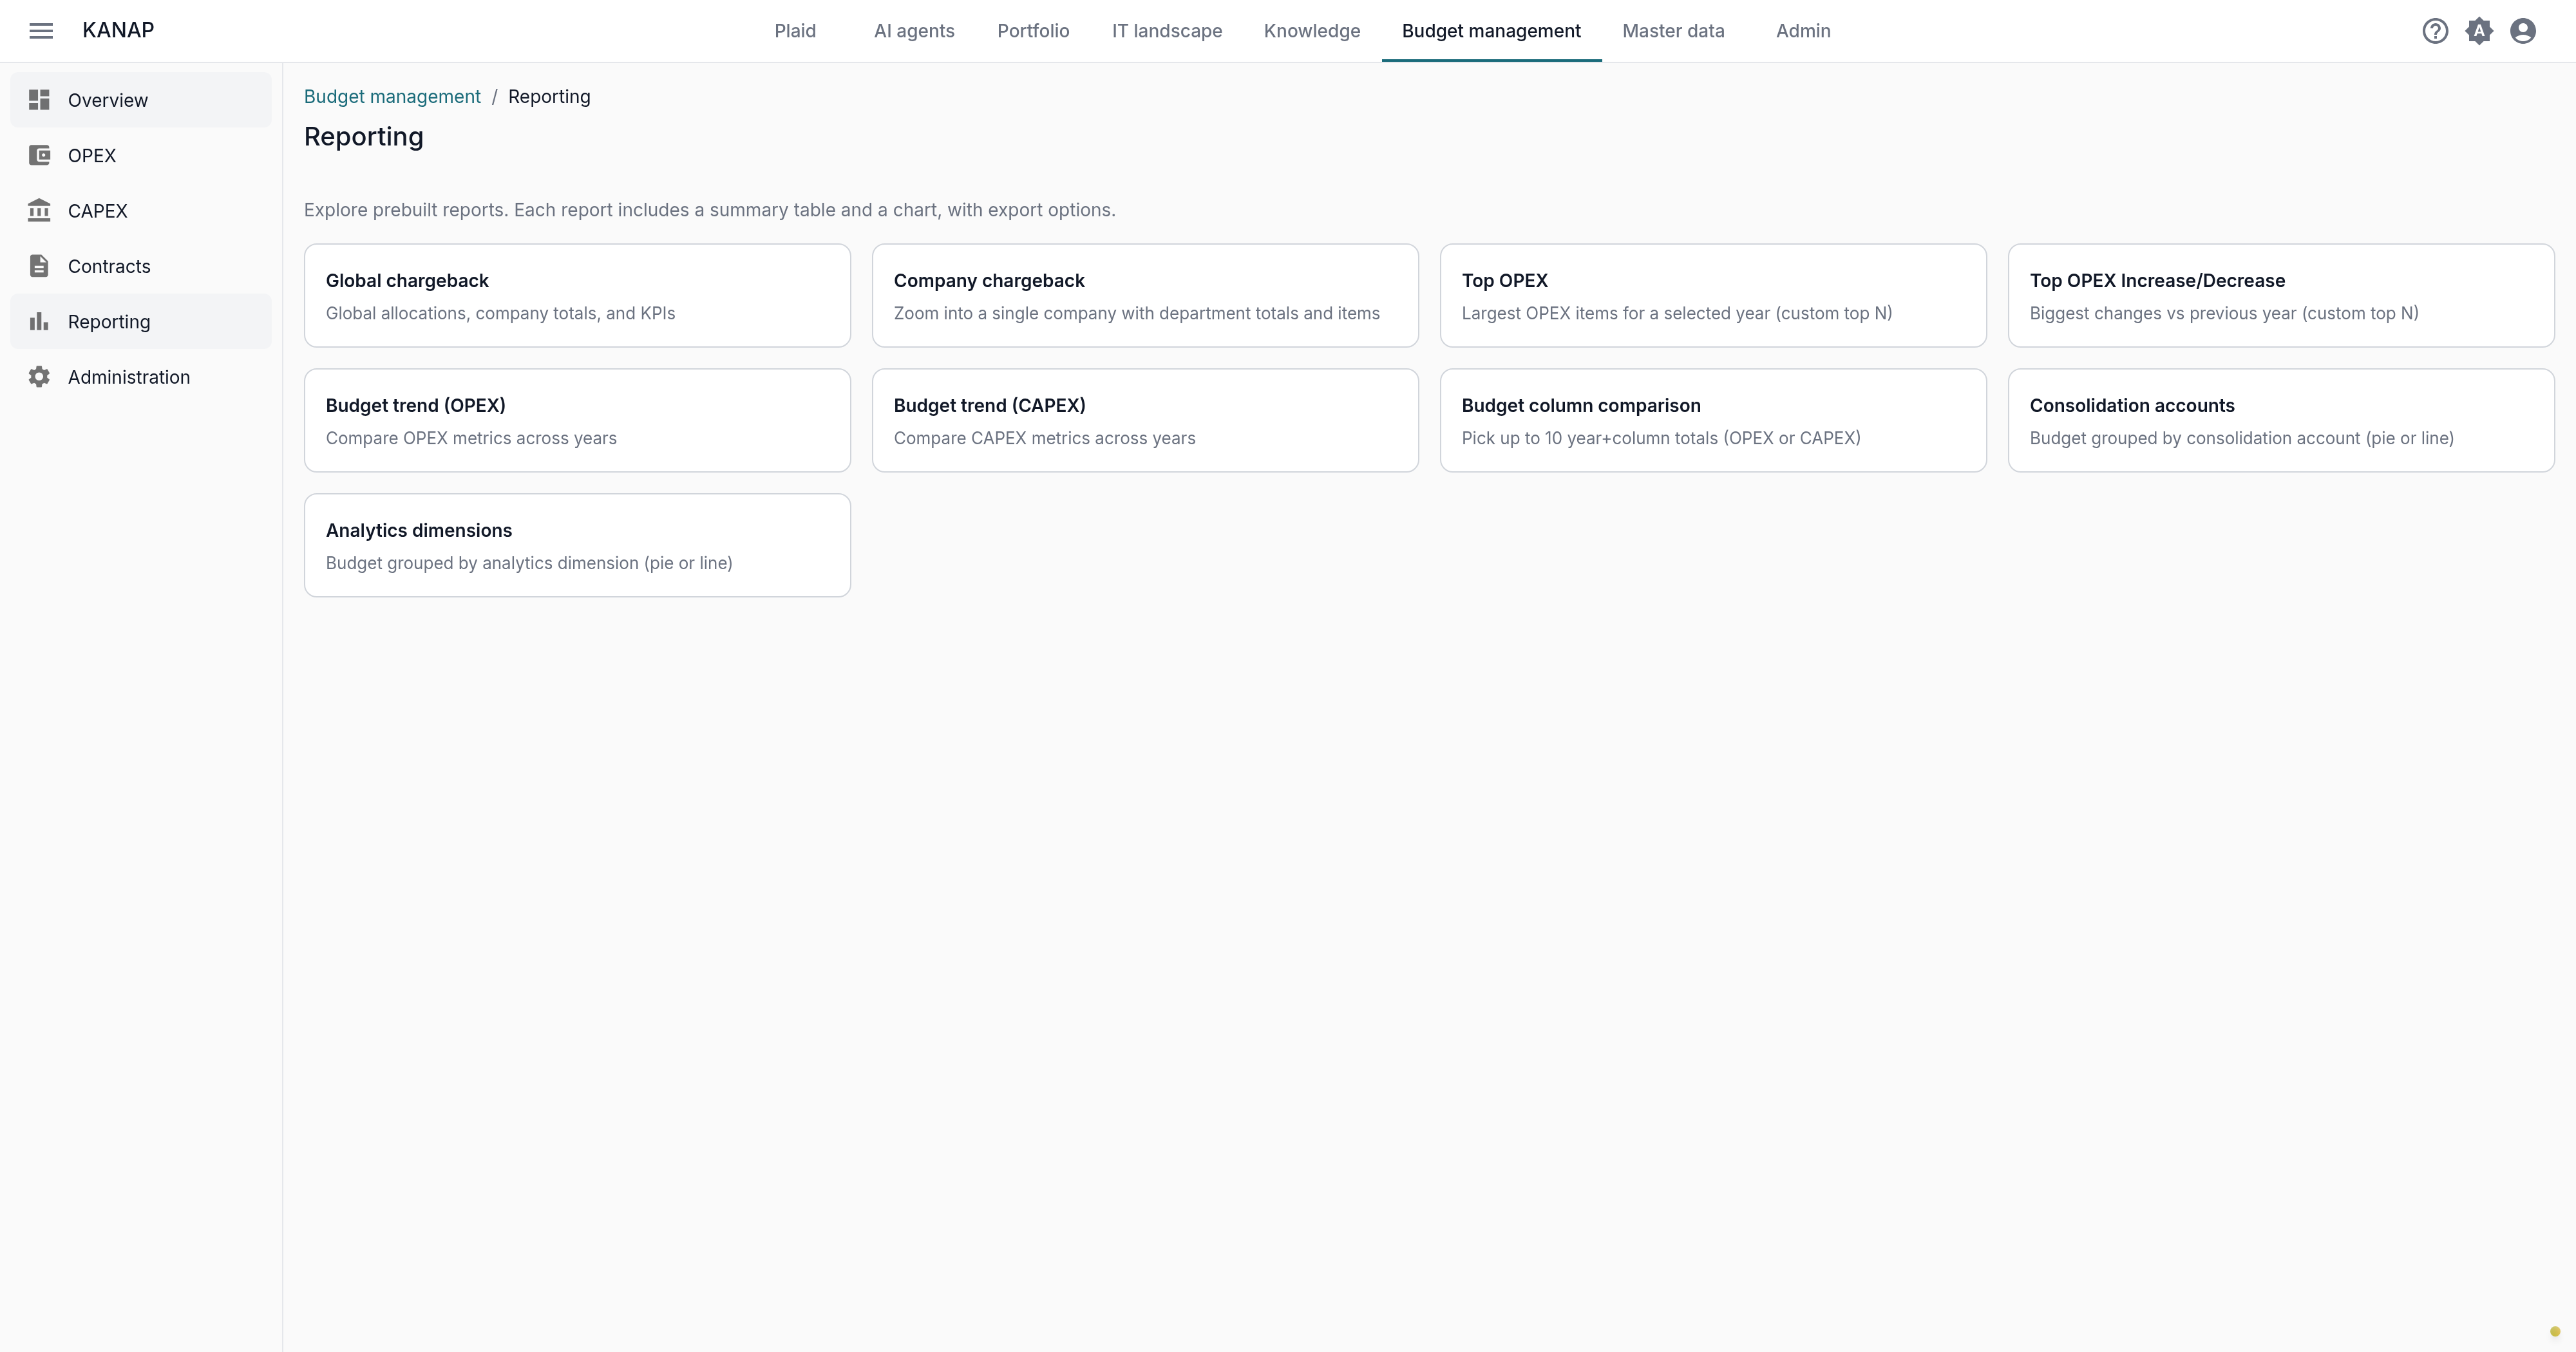
Where do we land, what goes up?
“Budget column comparison” puts Budget 2026, Expected landing 2026 and Budget 2027 side by side. The gap between budget and landing measures the quality of the forecast; the gap between landing and 2027, the effort asked for next year.
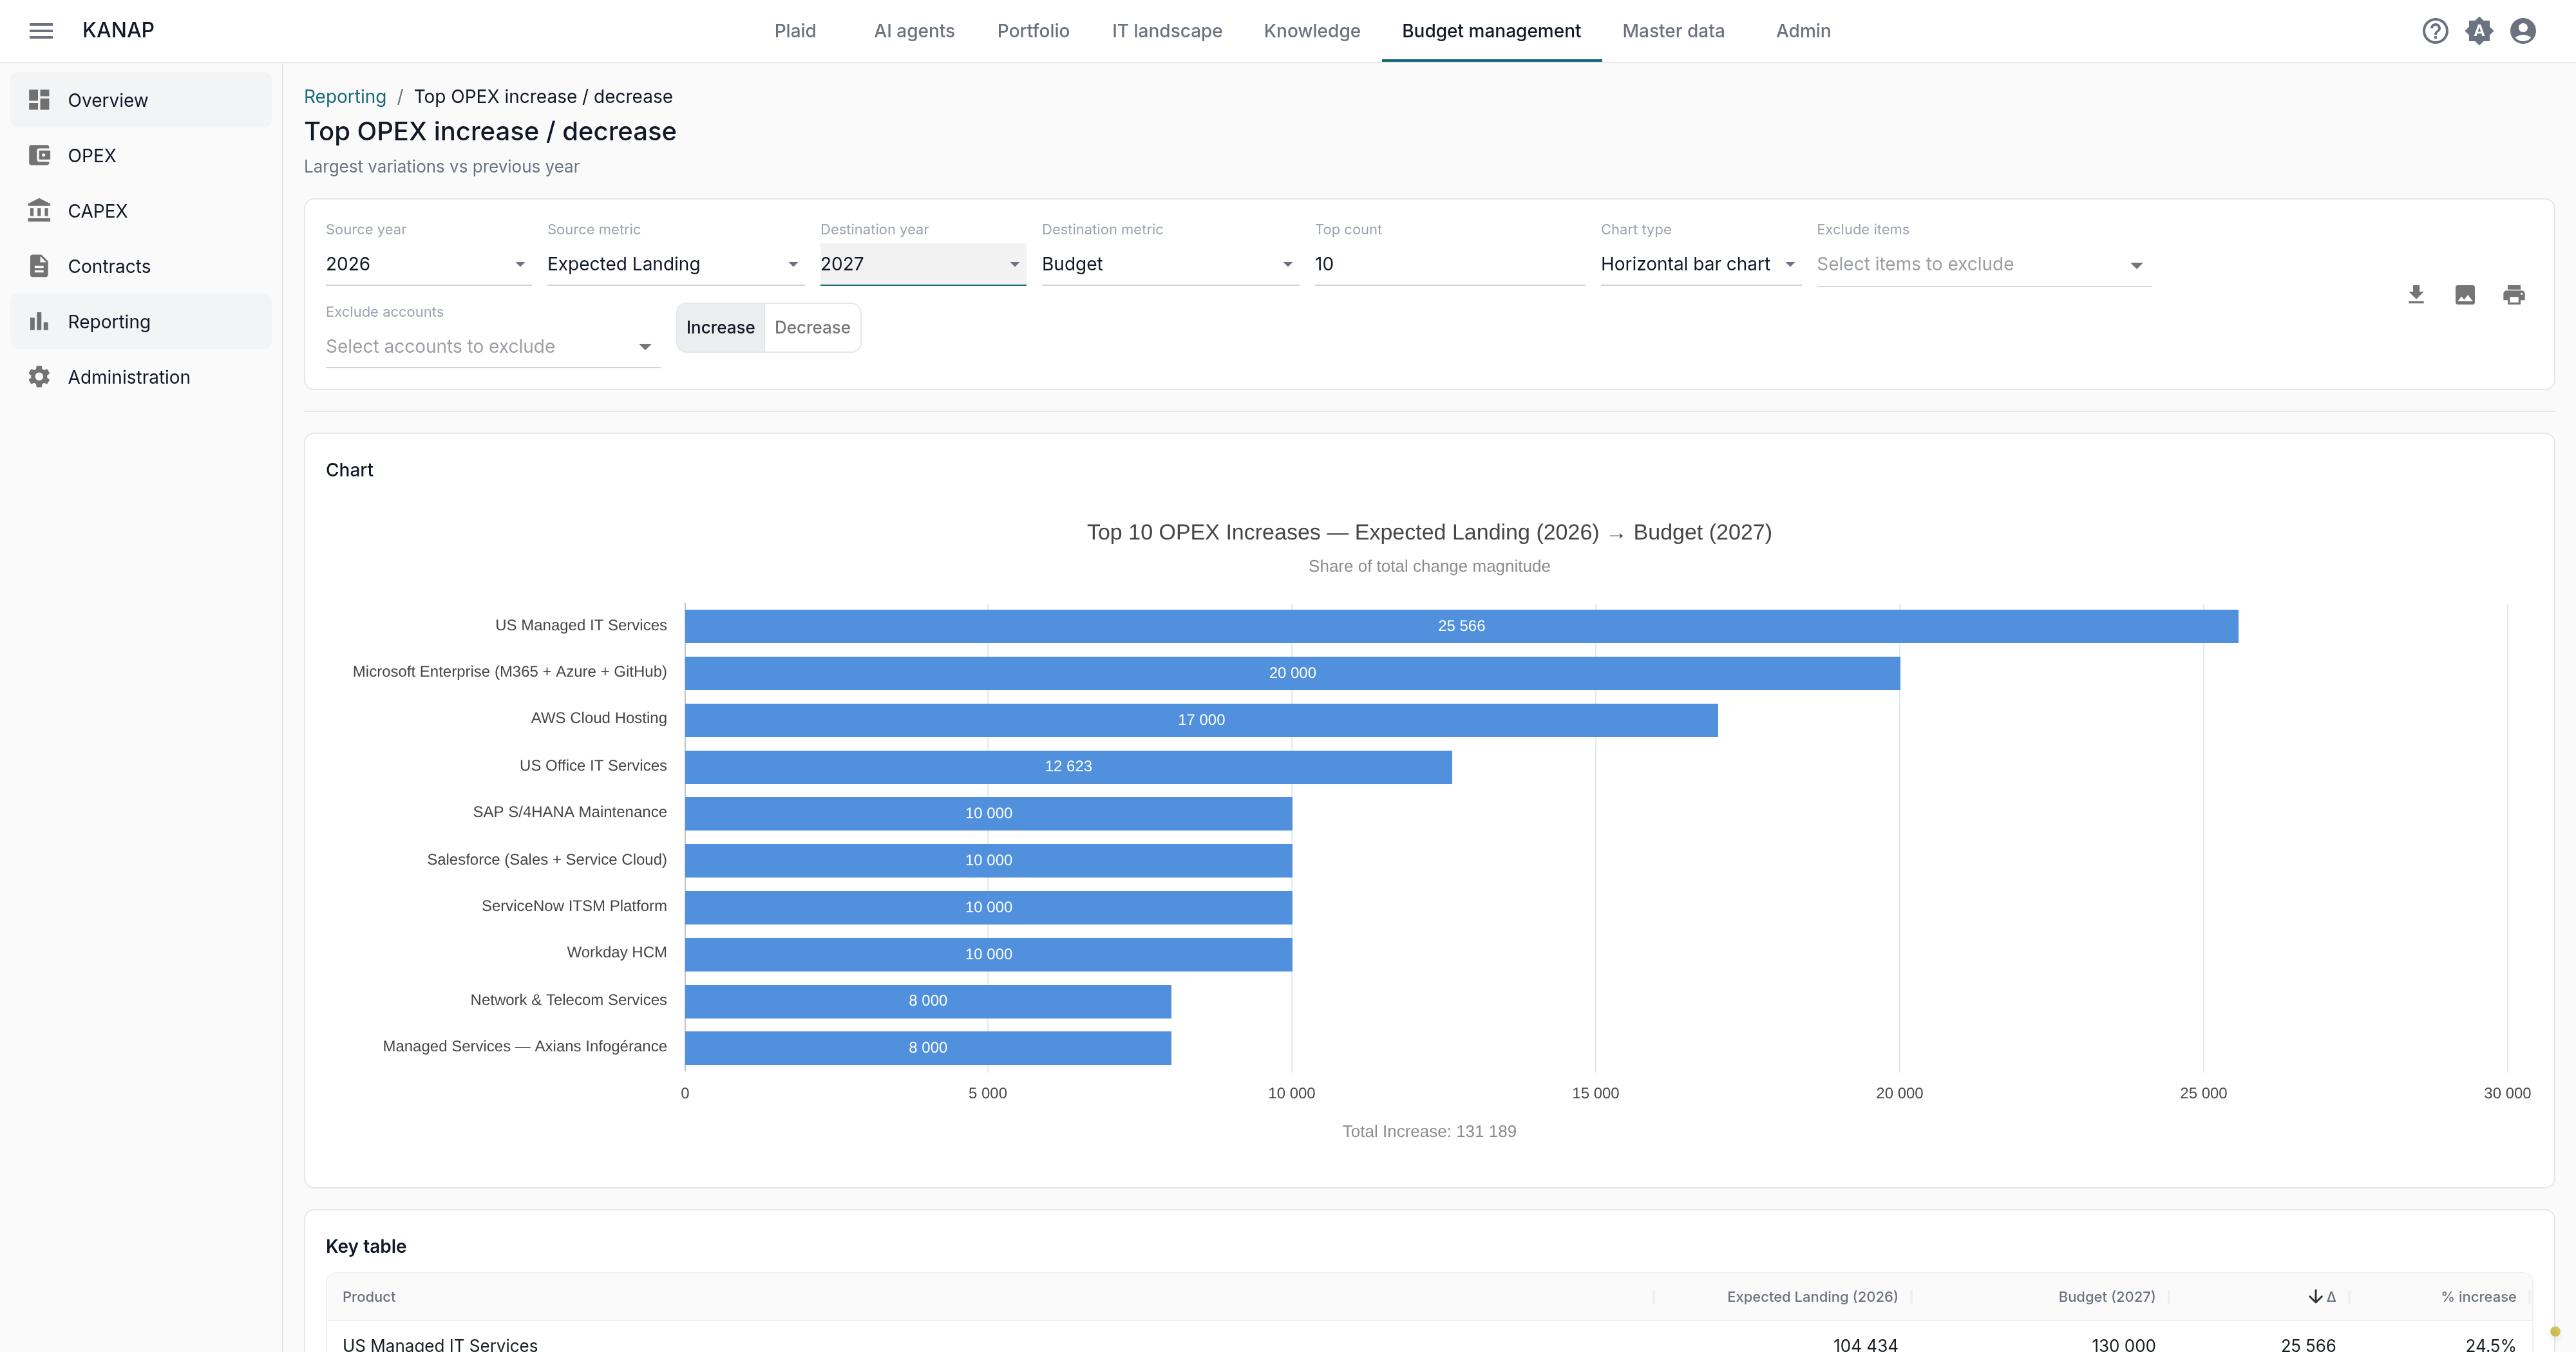
“Top OPEX increase/decrease” then names the lines that explain the gap. Often the most interesting slide of the deck.
Finally, “Top OPEX” shows at a glance the largest items of your budget, where the budget is usually decided.
These reports, and the others you will explore, are fully configurable and quickly produce solid figures and charts to support your budget presentation.
Who pays what?
“Global chargeback” and “Company chargeback” convert part 2’s allocations into totals by company and/or department, based on the chosen metrics (headcount, turnover, and so on). Ever been asked “how much does department X’s IT cost us?”. This time the answer is ready: in absolute value, as a percentage, and per user.
Even if your company does not charge costs back, these reports are a gold mine for spotting the hidden costs of IT, and for showing management the cost of niche solutions that stay invisible in the budget’s top 10.
OPEX and CAPEX, side by side
One selector switches the column comparison from one envelope to the other, and “Budget trend” exists for each. Operations and investments are presented in the same meeting, with the same tools and the same exports.
Export
Every report exports: table as CSV, chart as PNG, full page as PDF. The deck comes together without screenshots, and you can even adjust a report live to answer ad-hoc questions.
The review phase
A budget is rarely approved on the first pass. That is what the Revision column is for: enter the working versions of the trimmed items there (or, who knows, the reinforced ones), then fill the empty cells back from the budget, with the same mechanics as in part 2.
In a few clicks you build a complete variant of the budget, which can then be copied (overwriting, this time) to the Budget column once approved.
Lock
Budget approved? In Administration, “Freeze / unfreeze data” locks columns. Freeze the 2027 Budget column, OPEX and CAPEX. Frozen columns turn read-only everywhere: entry, CSV imports, copies. The figures approved in committee will not move again, and become the reference for the next cycle.
Across three parts we covered a full budget cycle: a reliable landing, the 2027 budget, the key figures and the presentation, the review, the lock.
Everything is ready for the next cycle.