
A report for every question in the IT department
The CIO, the project manager, the team lead and the engineer each have their own questions. KANAP's portfolio reports answer them in one click.
Monday, 9 a.m., the IT department’s weekly meeting. The CIO spent Sunday evening merging three files to find out where the projects stand. The project manager arrives with a plan she updated on the train. The systems team lead says his team is “drowning”, with no figure to show it. The network engineer explains that he mostly did run work this week, and nobody knows how much.
Everyone has a real question. Everyone answers it with their own tools, and the meeting spends half an hour reconciling numbers.
Every answer already exists in KANAP. Each request, project and task leaves a trace there: its creation, its status changes, its closing, the time logged on it. The portfolio reports read that history and show it to each person from the angle they care about.
The CIO: what moved, and what is stuck?
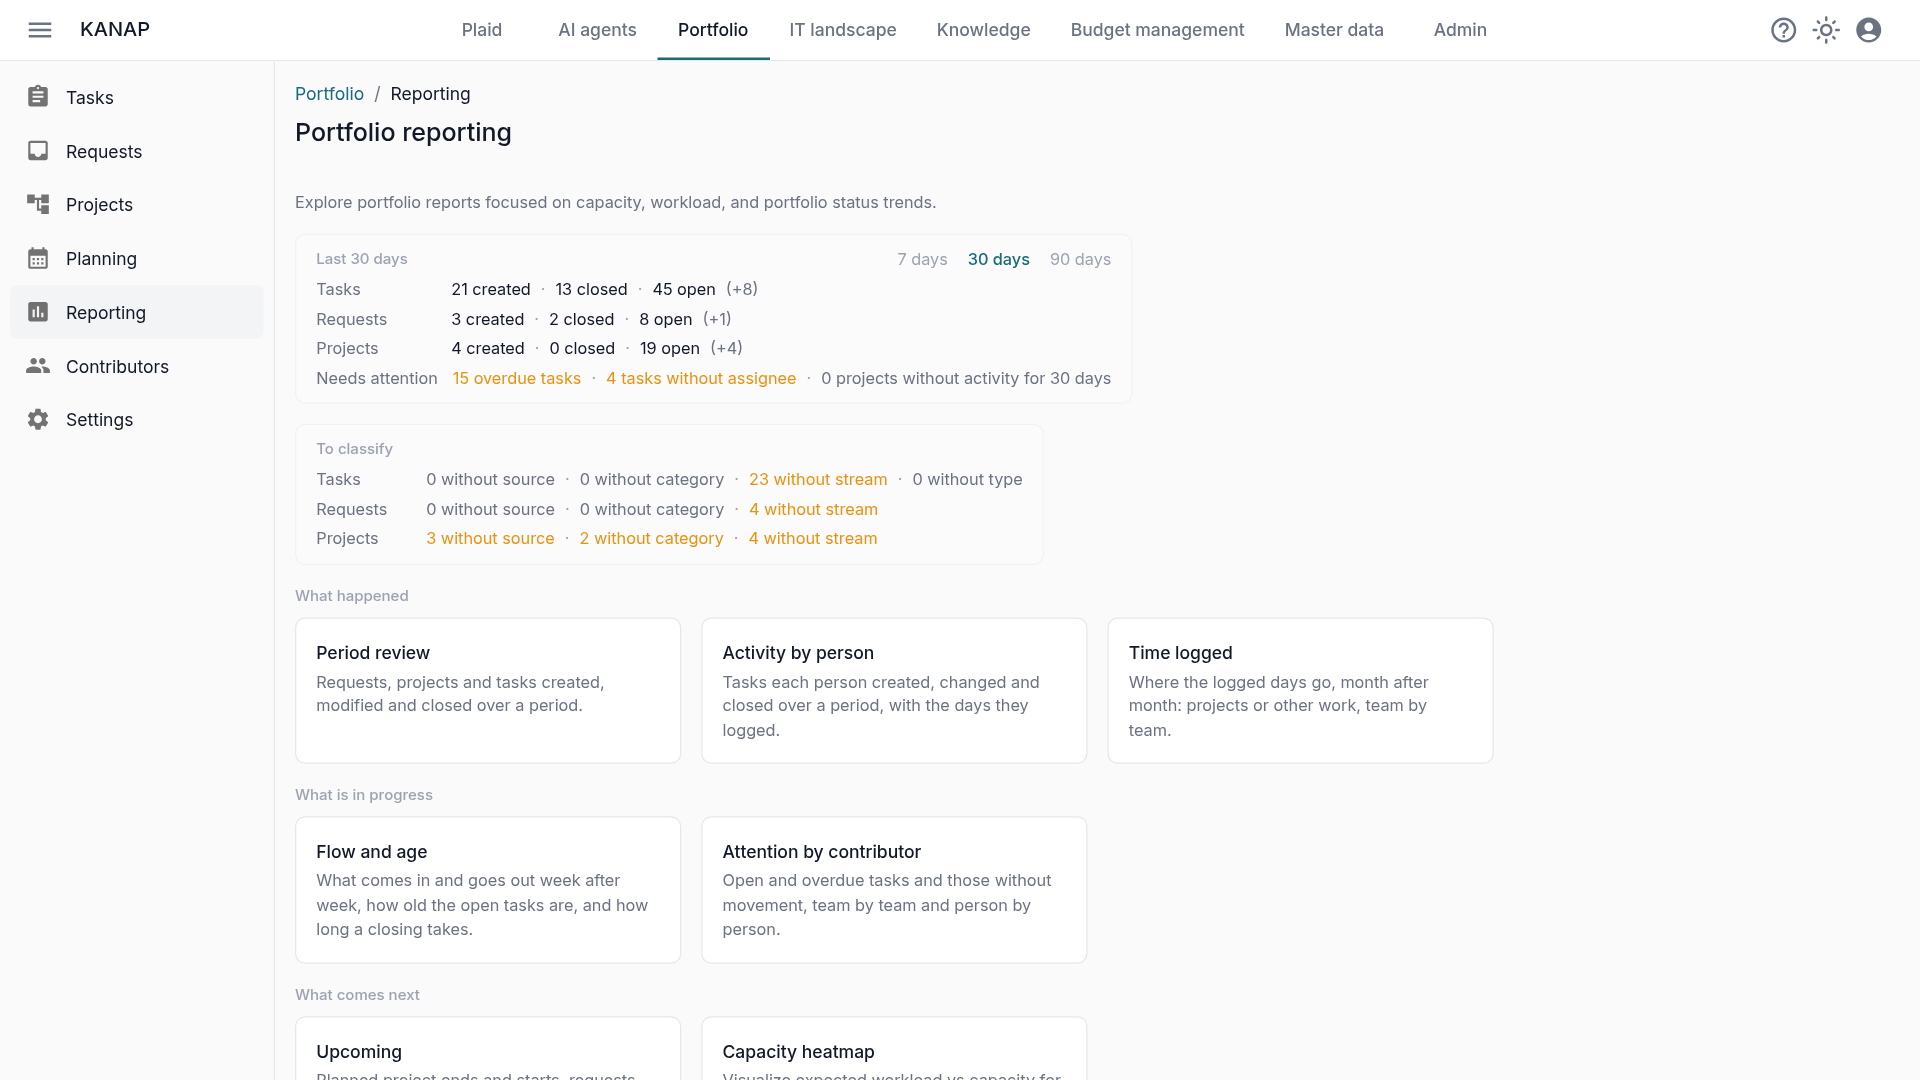
The CIO needs an overview in one minute. The strip at the top of the reporting page gives it in three lines: tasks, requests, projects. Each line reads the same way: 14 created · 9 closed · 52 open (+5), over the last 7, 30 or 90 days. The last figure is the change in stock: creations and reopenings, minus closings.
Right below, the Needs attention line appears when a decision is waiting: overdue tasks, tasks without an assignee, projects in progress or in testing with no activity for 30 days. A project counts as active as soon as something moves on it or on its tasks: a change, a journal note, logged time. The ones left on that list are really at a standstill, and one click shows them with the date of their last activity.
The other figures open the list filtered on exactly the items counted. Creations and closings open the Period review on the same days.
For the executive committee, the Period review tells the week or the month in portfolio order: requests, then projects, then tasks, each in three lists (created, modified, closed). A new project shows where it came from, for example the request it was converted from. The review filters by source, category, project or team. It exports to CSV or XLSX, and prints cleanly to PDF, like every report.
The project manager: what is coming, and what changed?
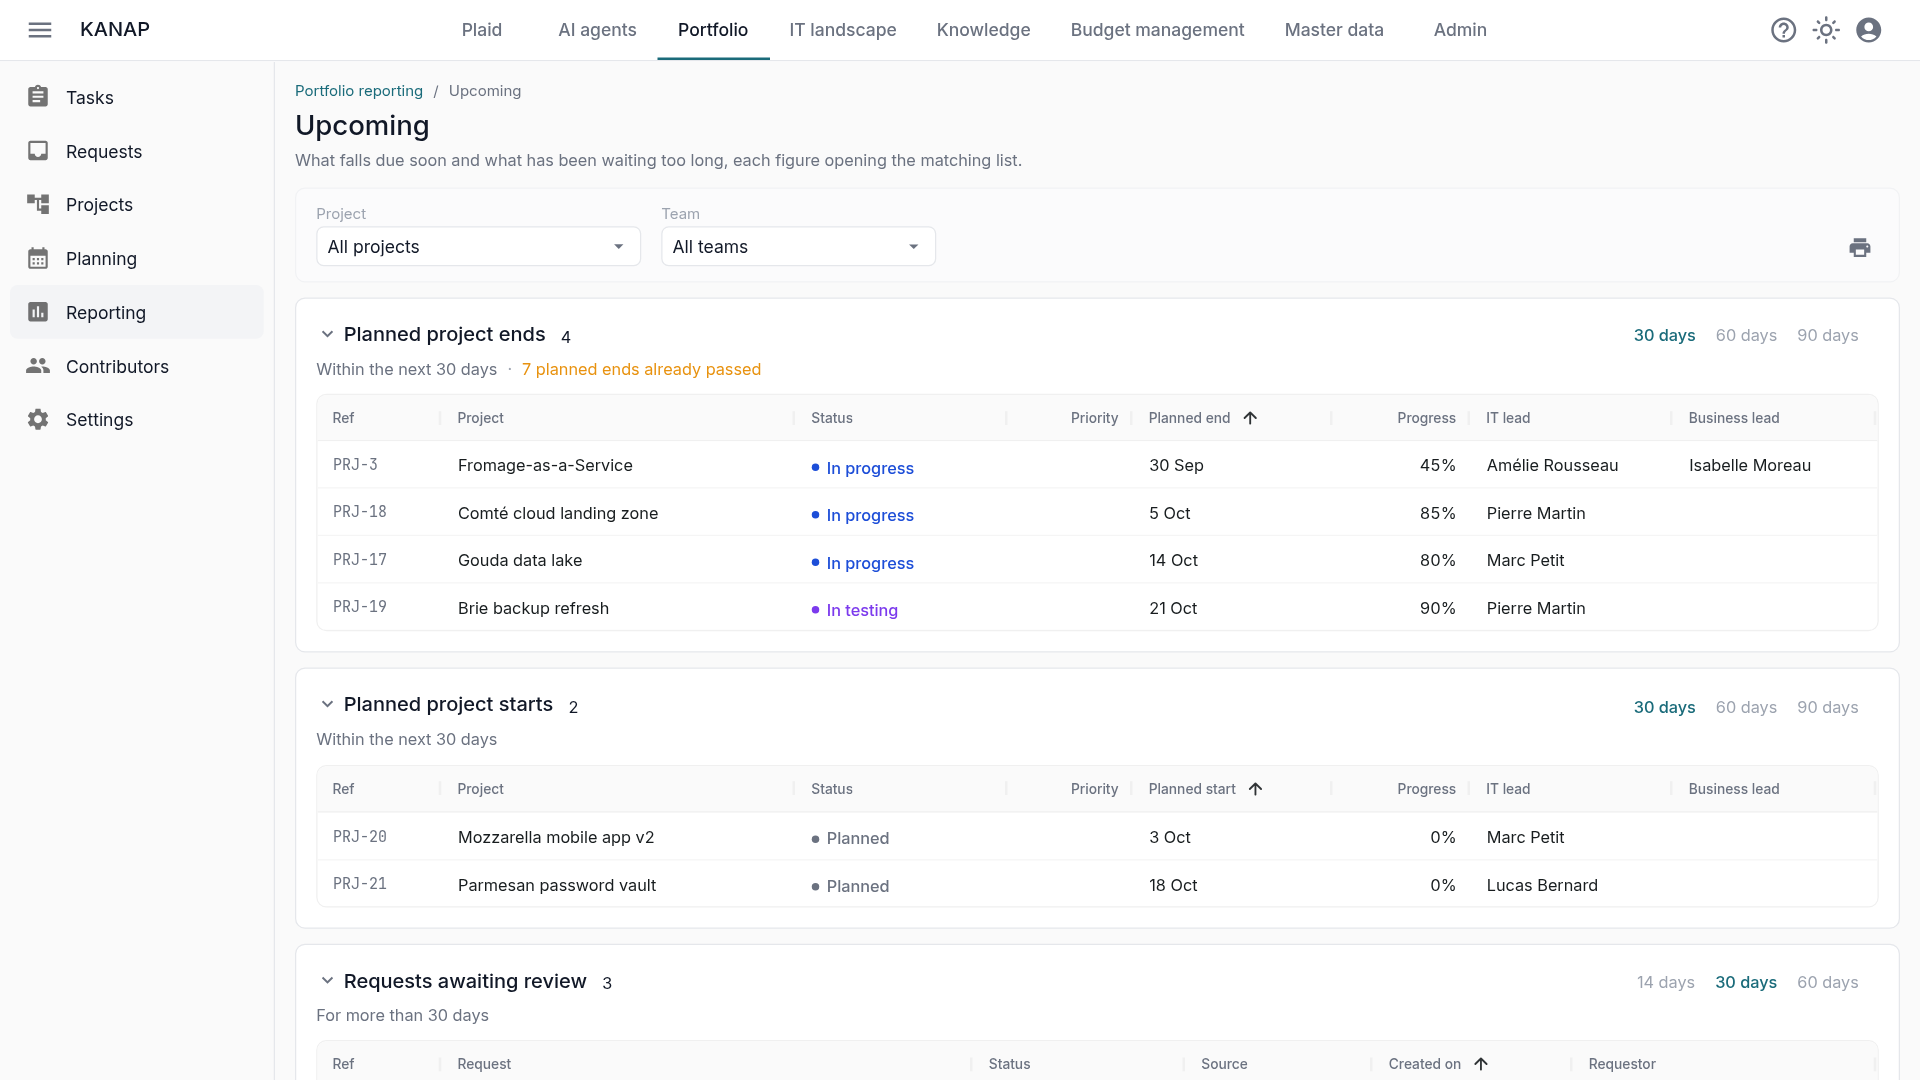
The project manager looks ahead. The Upcoming report gathers what falls due soon: planned project ends in the next 30 days, planned starts, tasks due in the next 14 days, deliveries requested by the business. Tasks already overdue and planned ends already passed are counted separately, with a link to them.
Filtered on her project, the same report becomes her roadmap for the next two weeks.
For the meeting with her sponsor, she opens the Period review filtered on her project. The Changes column sums up what changed on each item, in plain words: In progress → In testing, then the fields that changed. Closed items carry two dates, Created on and Closed on, so the real duration of each task reads at a glance.
The team lead: who needs help?
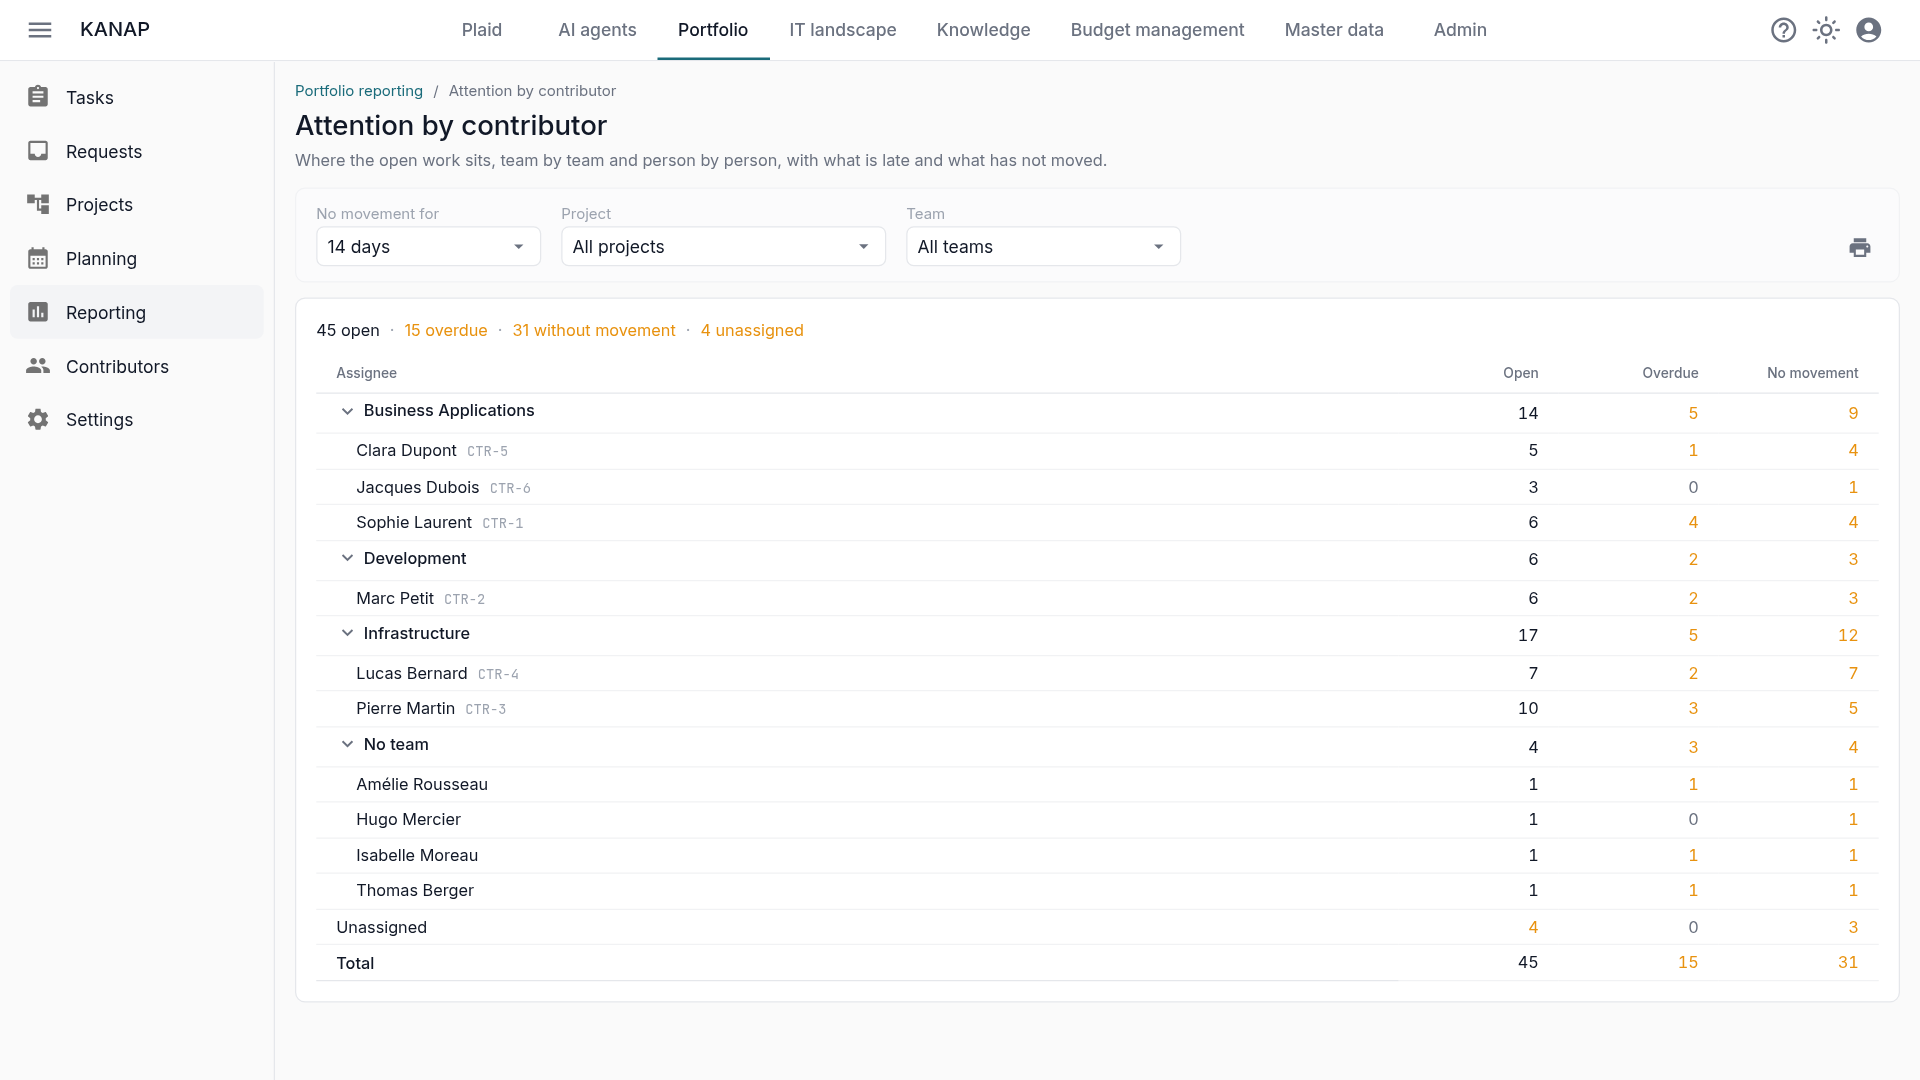
“My team is drowning” becomes a fact with numbers. The Attention by contributor report lists, team by team, each person’s open tasks, the overdue ones and the ones that have not moved for 14 days. Each figure opens the matching task list, and the team meeting starts with them.
The Capacity heatmap sets the remaining project load against each person’s capacity, in months of work: green up to one month, then yellow, orange, red, and purple beyond a year. Unassigned work has its own total. The team lead comes to the trade-off meeting with months of work, and the discussion is about priorities.
Finally, Flow and age shows whether the backlog is growing: tasks created and closed week after week, requests and projects month after month. It also gives the age of open work, the items stuck in the same status (more than 30 days for a task, more than three months for a request or a project) and the median time to close.
The engineer: making day-to-day work visible
The engineer spends a good part of the week on updates, incidents and access requests. That work matters, and it rarely shows in a project portfolio.
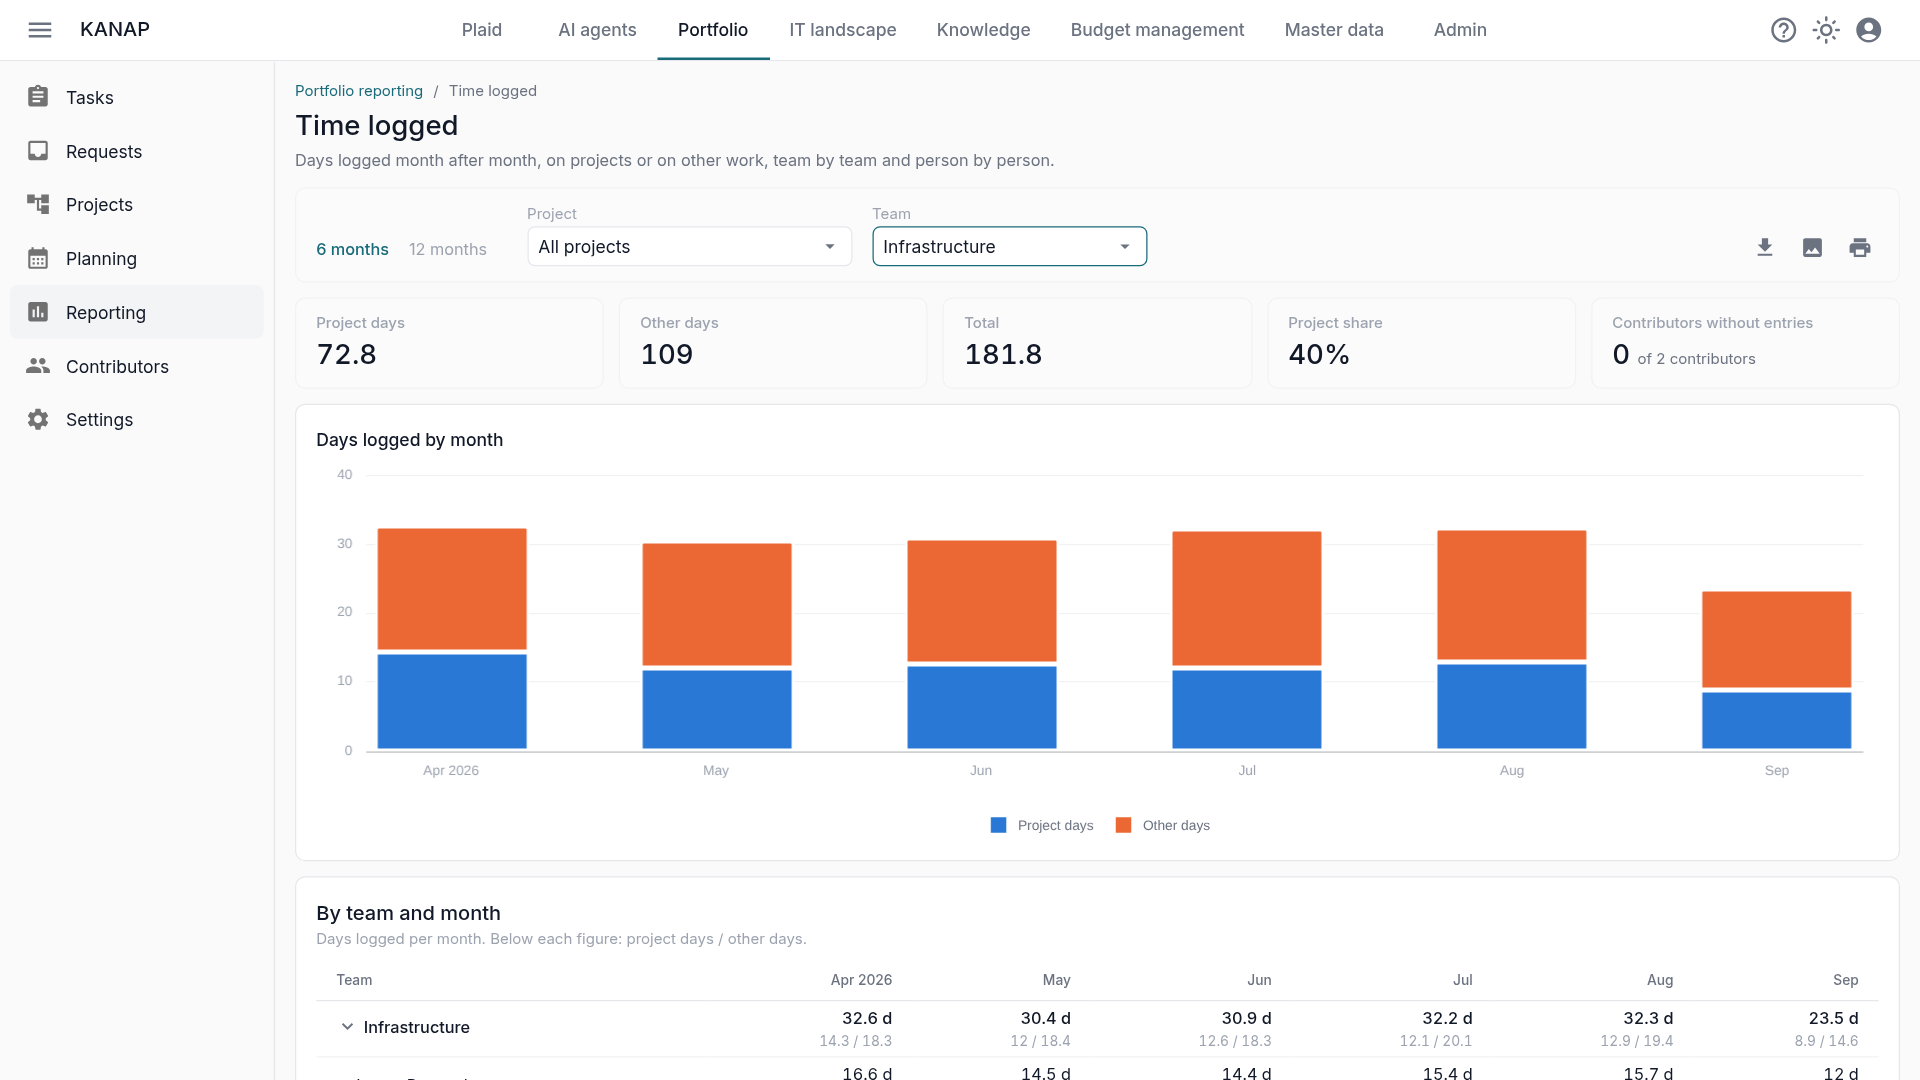
The Time logged report brings it out. It splits the logged days, month after month, between projects and other work, team by team. In the example below, the Infrastructure team spends 60 % of its days on run work. When IT management sees that figure, the conversation about priorities changes.
These reports exist to spread the load. Teams keep the order IT management chose, people are listed alphabetically, and the report shows days, never the content of time entries. A closed task is credited to the person who held it when it was closed. Activity by person then shows, team by team, the tasks each person created, moved forward and finished over the period, with the days they logged.
Back to Monday morning
The following week, the meeting starts on the room’s screen. The CIO opens the reporting page: the top strip gives the state of the portfolio, and the Needs attention line sets the agenda. The project manager shows Upcoming on her project. The systems team lead shows his attention report and his capacity heatmap. The engineer shows the share of run work in his team’s time.
Everyone reads the same figures, from the same tasks. The meeting lasts twenty minutes and ends with decisions.
In practice
The reports live under Portfolio > Reporting. They need read access to the portfolio reports, and work in the cloud and on-premise. They read the data you already have: the tasks, projects, requests and time your teams already record.
The rest of the portfolio is described on the Portfolio page.