
FTE and daily rates: external contractors in the IT budget
Budget a service the way you buy it, in people, days and prices: KANAP derives the FTE, the cost per FTE and the daily rate, ready for the committee.
During budget season, the question always comes up: how many contractors does IT pay for, at what cost, and what changes next year? Often, the answer lives in a spreadsheet, sometimes only in the signed contracts, or in a parallel tracker kept by procurement. And it never quite matches the budget.
In KANAP, one entry is enough. You budget a service the way you buy it: people or days, a price, a period. KANAP derives the amount of each month, the FTE, the cost per FTE and the daily rate.
FTE, cost per FTE, daily rate
- FTE (full-time equivalent) says how many people the budget pays for. A full-time consultant for the whole year counts as 1 FTE. From February to October, they count as 0.75 over the year.
- Cost per FTE is the average yearly cost of one full-time person.
- The average daily rate is the cost of the services priced per day divided by the days bought.
KANAP gives two readings of FTE. The full-year average feeds the reports and the comparisons from one year to the next. The FTE over the period says how many people work during the assignment: our consultant from February to October counts as 1.
This article is about external resources: staff augmentation, technical assistance, packages of days. That is where the IT budget is built in people and days, and where the committee’s questions concentrate.
Data entry: each line reads like a sentence
On the Budget tab of a budget line, each column (Budget, Expected landing, Revision…) can be built with Quantity and price. A line reads like a sentence: a quantity, a unit (people, days or pieces), a price, a frequency, a period and a calendar. The amounts of each month are the sum of the lines. A few common cases:
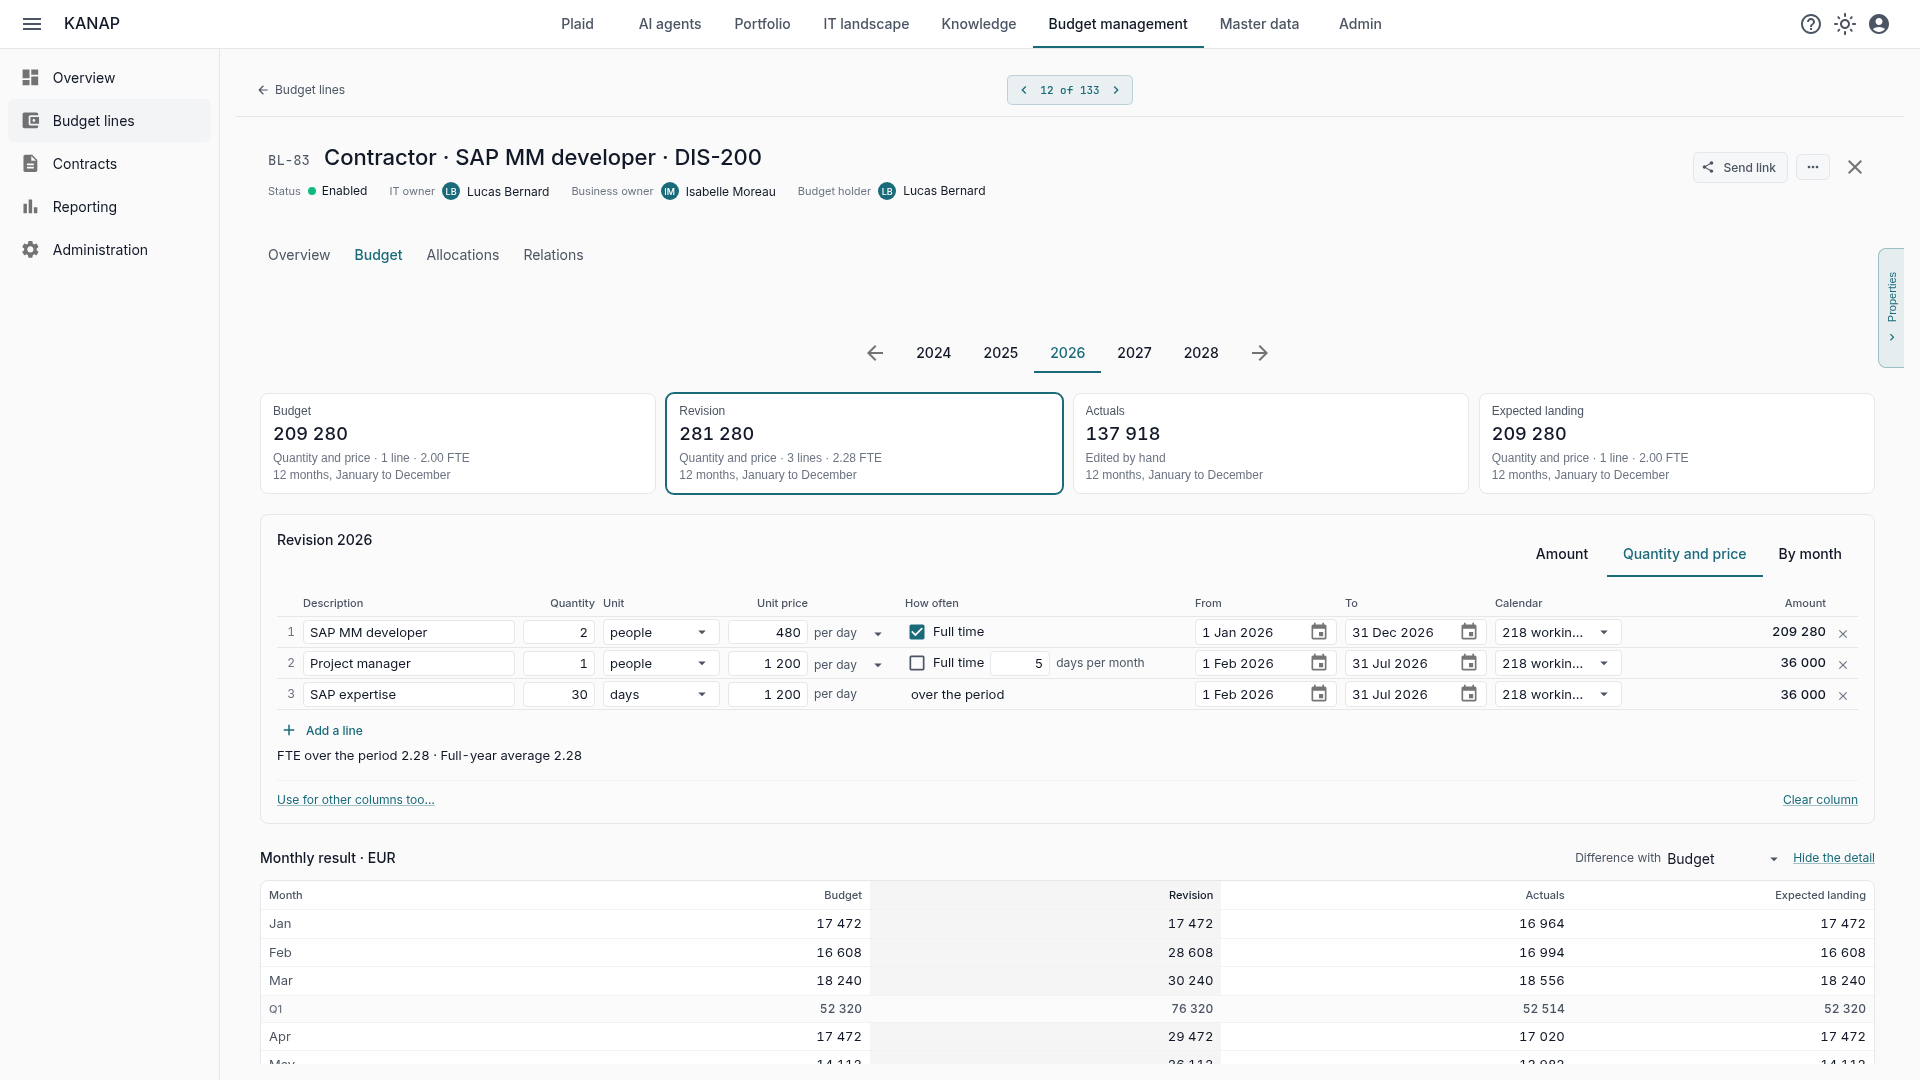
Full-time staff augmentation. Two SAP developers at €480 per day, full time all year. Each month counts its working days: on a 218-day calendar, the line costs €209,280 and counts as 2 FTE.
Part time. A project manager 5 days a month at €1,200 per day, from February to July: €6,000 a month. KANAP relates those 5 days to the working days of each month, a little over a quarter of full time during the assignment, and half that over the year.
A package of days. 30 days of expertise bought for the same period, at €1,200 per day: €36,000, spread over the months of the period and converted to FTE the same way.
Arrivals and departures. Each line has its own period. At Fromage & Co, our sample company, the integration architect at €950 per day was planned for February in the budget. They arrive in April: you move the start date in the expected landing, and KANAP recomputes the amount and the FTE of the year, 0.92 in the budget and 0.75 in the landing.
The result shows as you type: the amount of each month, and the FTE under the lines. In the example below, the two developers, the project manager and the package of days come to €281,280 and 2.28 FTE, and the column card sums it up: “Quantity and price · 3 lines · 2.28 FTE”. Use for other columns too carries the same lines over to the landing or the revision, which then only need adjusting.
Calendars: accurate to the day
A service priced per day costs the number of days actually paid. The working-day calendar says how many, month by month.
A country’s standard calendar is created with the company: weekdays, less public holidays. There is nothing to enter. A new line takes the calendar of the paying company’s country.
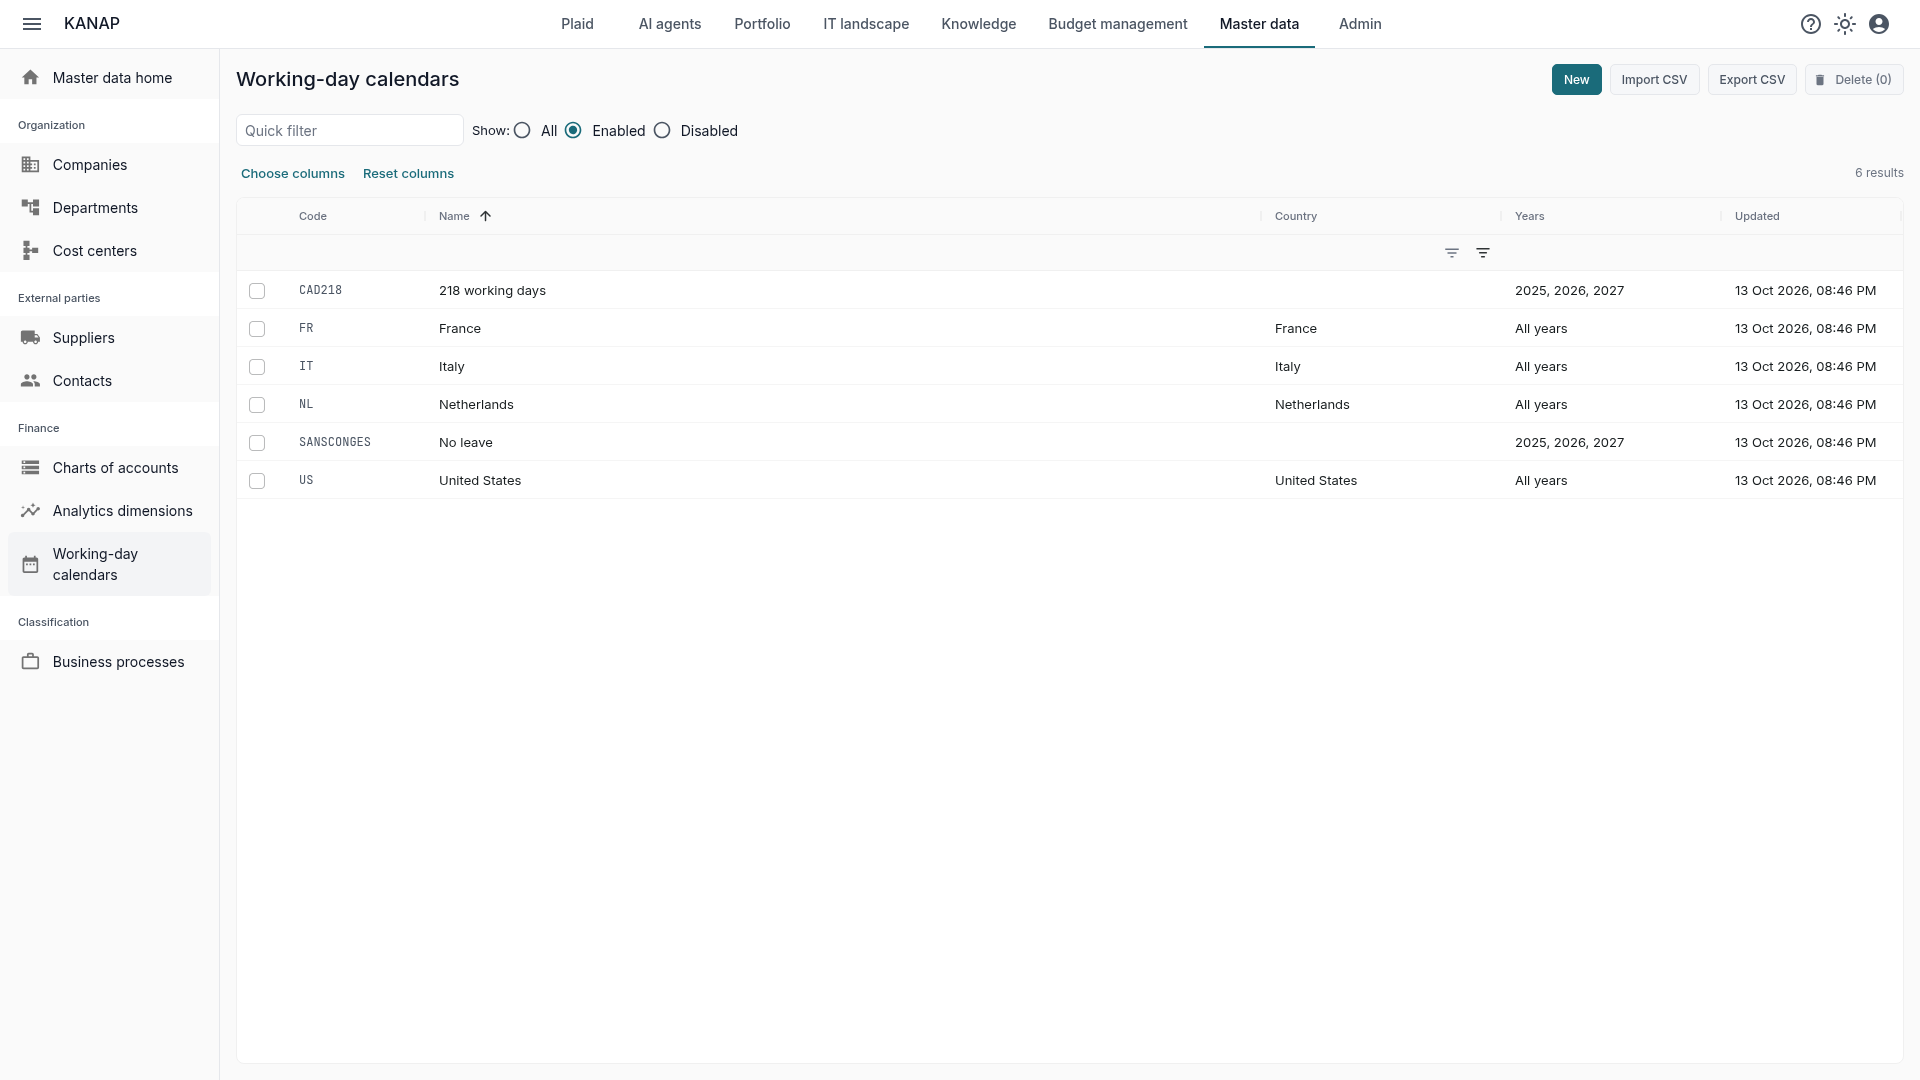
A custom calendar covers the special cases. Fromage & Co has two. 218 working days follows the rhythm of a consultant on a days-based contract, with leave spread over the year. No leave counts every working day, for a service billed per day actually worked. And of course, you can create your own calendars, place leave in them, and so on.
The budget in FTE, in the list
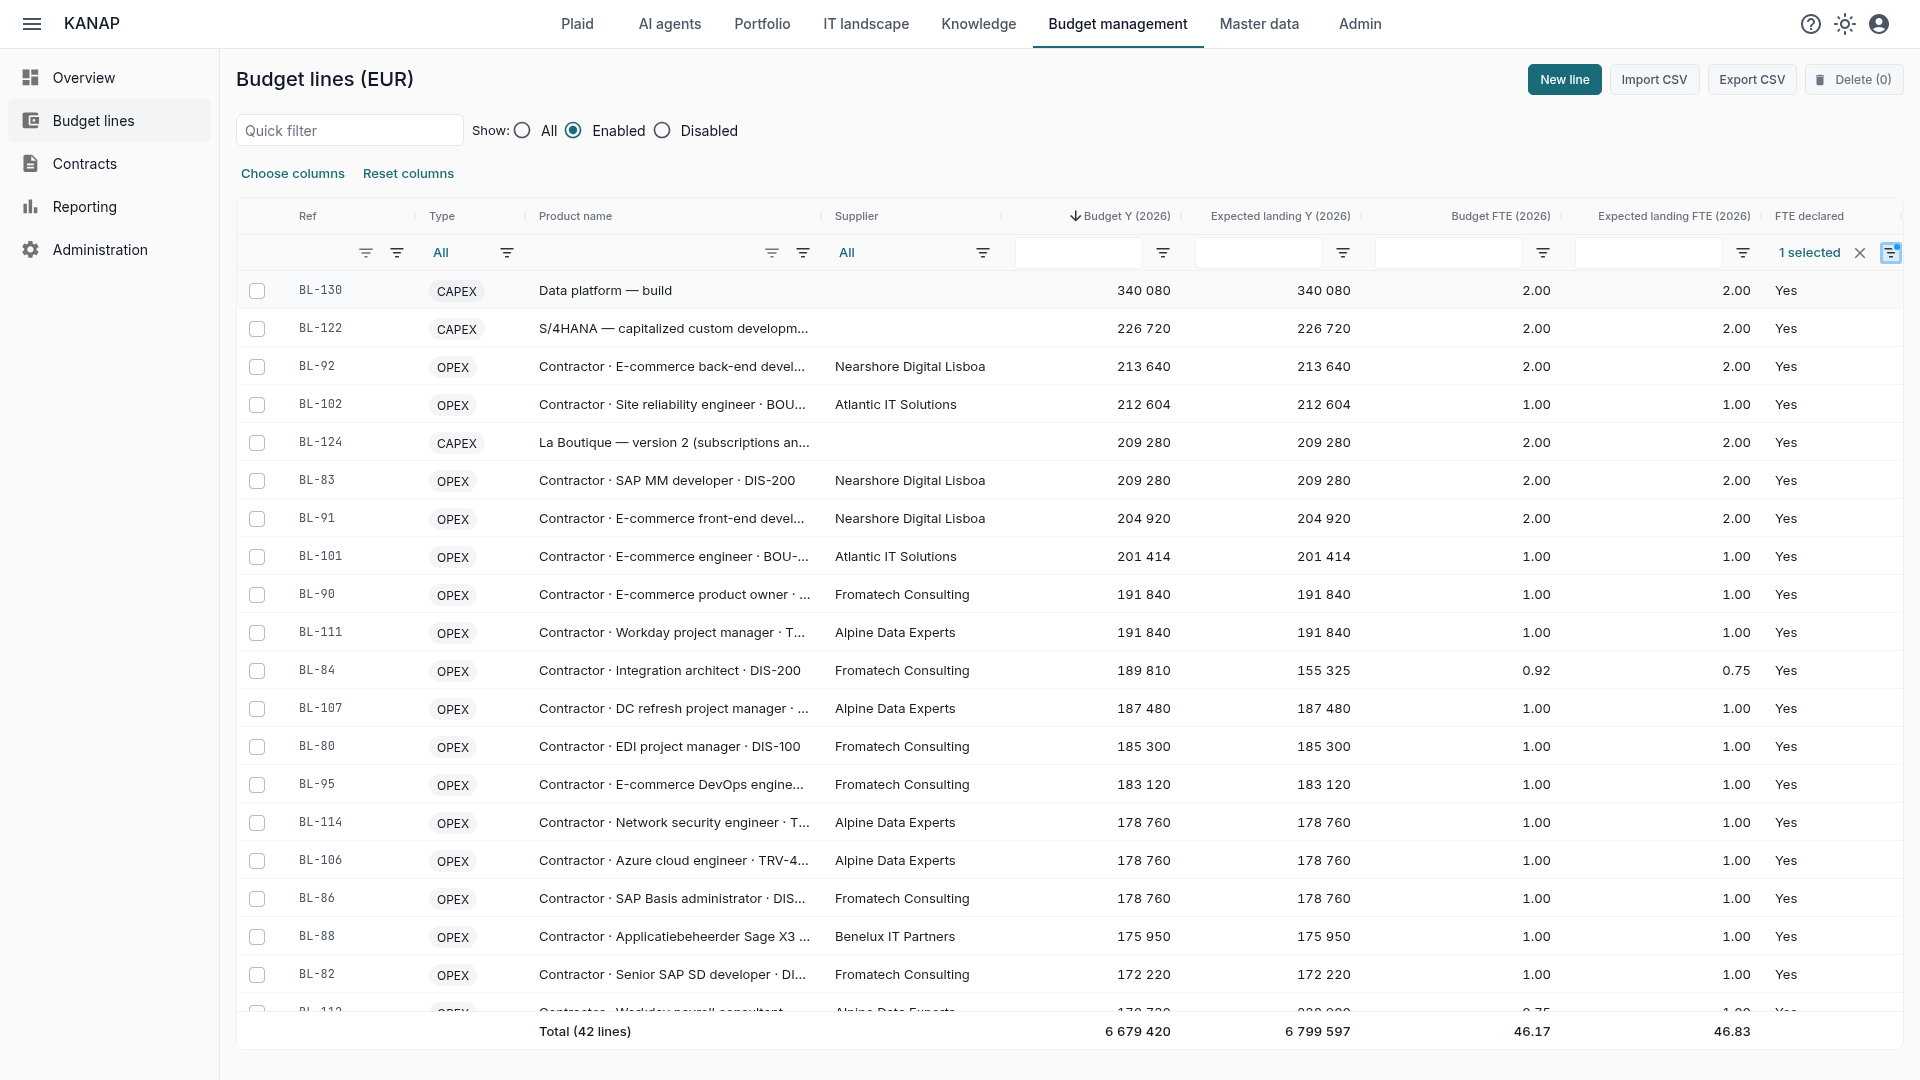
The budget lines list shows one FTE column for each budget column and each year, right after the amounts. It sorts and filters like the others. The column footer gives the total, and flags the lines without FTE: “3.50 · 12 unknown”.
The FTE declared column isolates the service lines in one click. You then see, side by side, what each service costs and how many people it pays for, in the budget and in the landing.
For the following year, copying the budget columns does the work: quantities stay, prices rise by the chosen percentage, periods move forward one year and each month is recomputed with the working days of the new year. The FTE follow (the details are in Building next year’s IT budget).
Reports: how many people, at what cost
Everything above feeds the reports directly. Nothing to prepare.
Staffing by month shows FTE month by month, grouped by cost center, supplier, line or analytics dimension. The table gives the year’s average and the peak. You can read the ramp-up of a project, the month when the external team is largest, and the weight of each supplier.
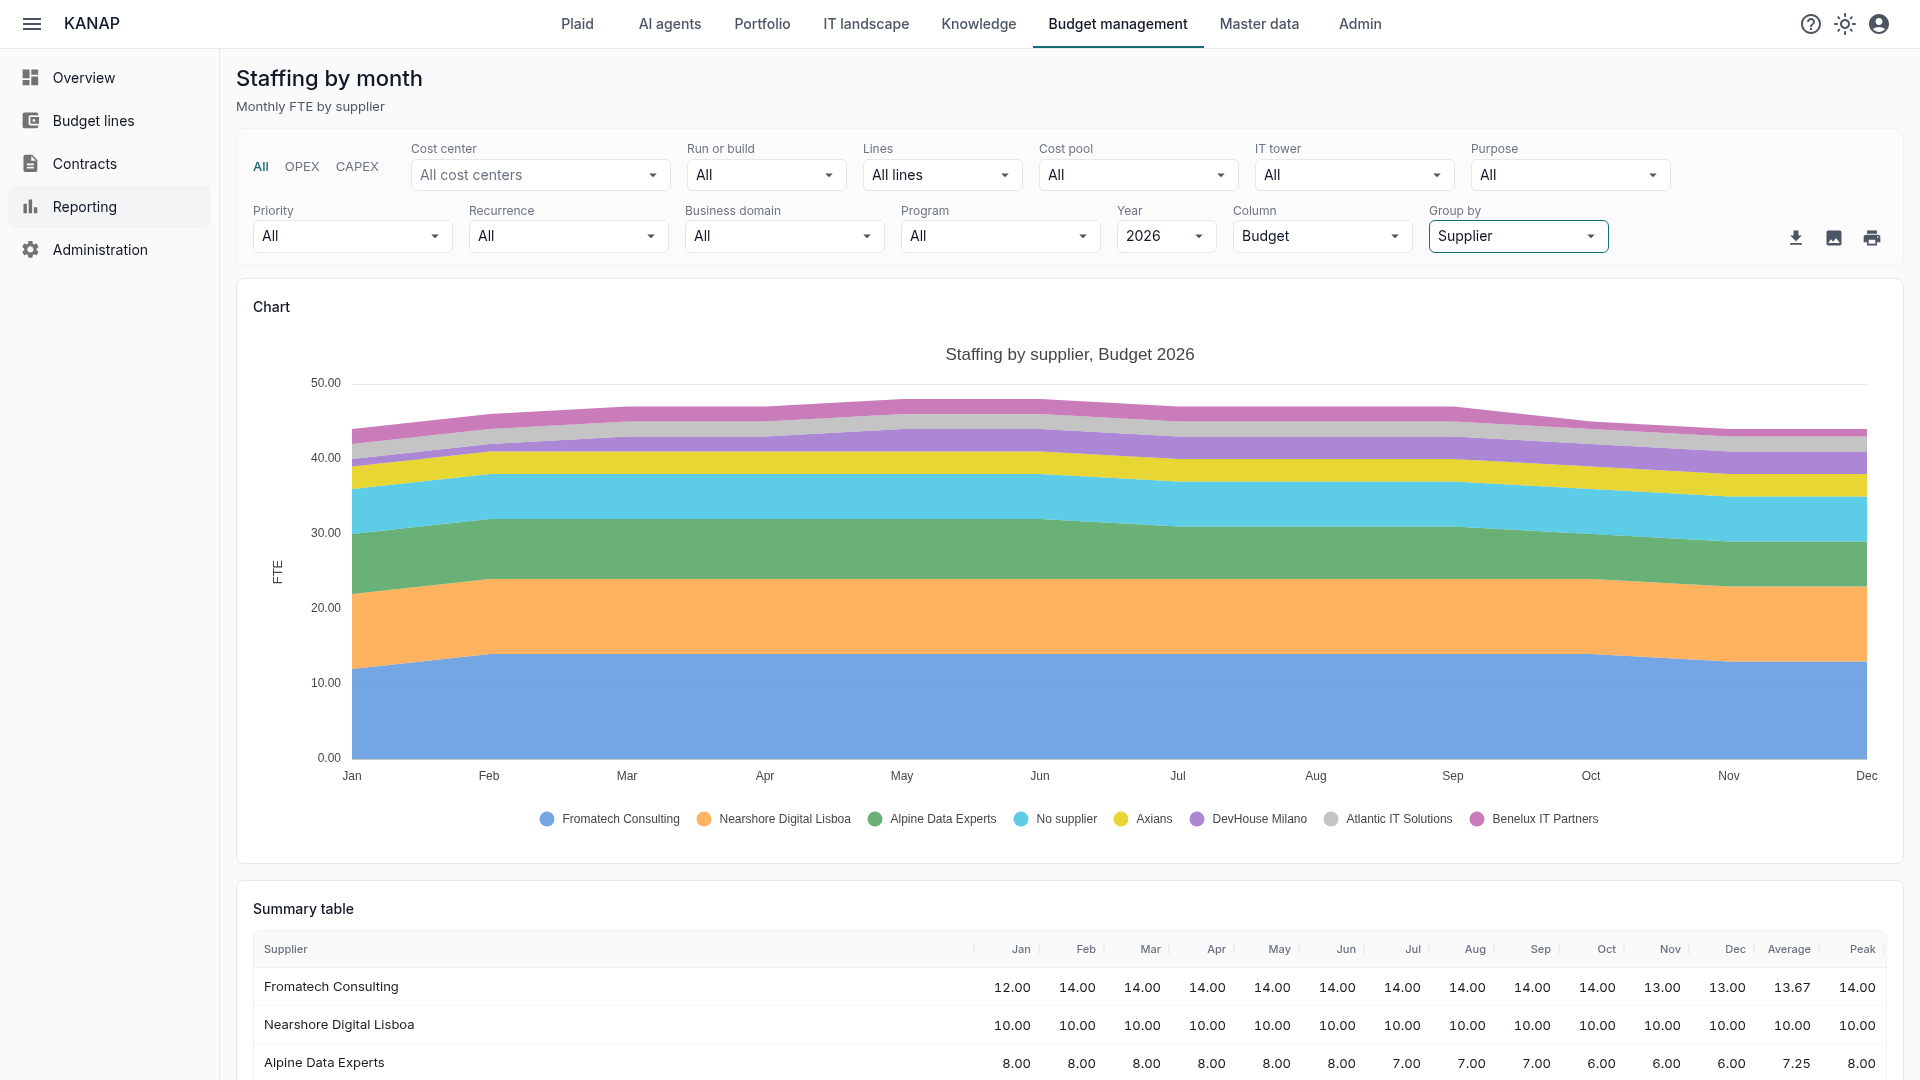
At Fromage & Co, the external team averages 46 FTE in the 2026 budget, peaking at 48 in May and June.
Cost per FTE puts up to four columns side by side, for example the budget and the expected landing, or this year’s landing and next year’s budget. For each group: the FTE, the cost and the cost per FTE. Show > Daily rate switches to the average daily rate in one click, weighted by the days bought. A supplier whose daily rate rises, a team that grows while the cost per FTE stays flat: you see it at once.
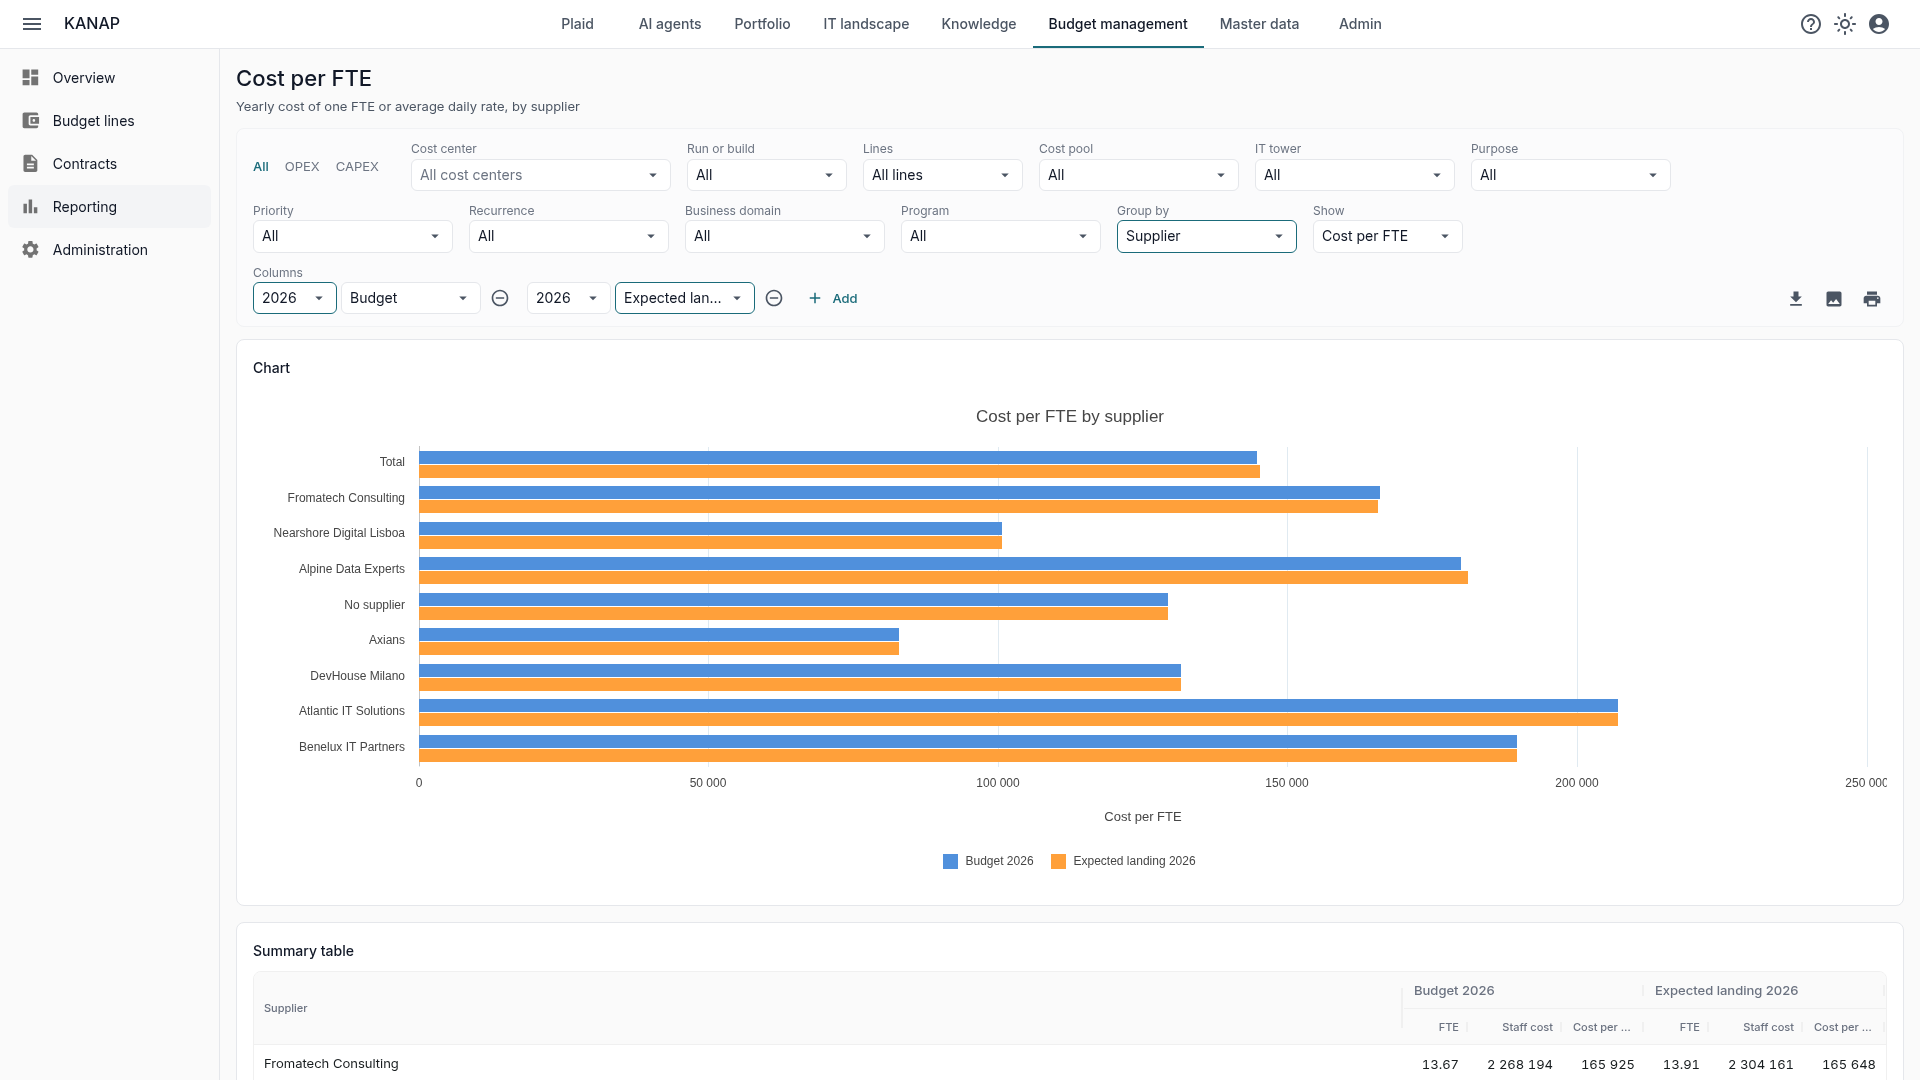
The 2026 budget of Fromage & Co thus pays for 46.17 contractor FTE at €6.68M, or €144,670 per FTE, and €145,197 in the landing. The gaps between suppliers stand out: €100,716 per FTE for the nearshore team in Lisbon, close to €180,000 for the infrastructure experts of Alpine Data Experts.
The other budget reports have a Measure select: Amount or FTE. Top increases, the budget comparison or the analytics dimensions then read in people. The Lines with FTE filter also compares the budget and actual amounts of the service lines alone.
The All, OPEX and CAPEX tabs and the dimension filters apply here too: the cost per FTE of capitalized development, or that of a program (see OPEX and CAPEX: the IT budget, ready for the finance review).
Every figure can be justified. A group’s name opens the list of its lines. A notice flags when a column’s amount no longer follows its quantity and price lines. The page link keeps every setting, and the table exports to CSV, the chart to PNG, the page to PDF.
What about internal teams?
Today, KANAP tracks external FTE. A future version will bring in the time of internal resources separately, to read internal staff and contractors side by side.
Meanwhile, internal time can already be valued simply: one line per profile, with its daily rate, on the budget line of the project or service concerned. An average cost per profile is enough to steer, and avoids exposing individual pay to every reader of the budget.
What KANAP does not do
KANAP is neither an HR information system nor a payroll tool, and it does not track time spent. KANAP’s FTE are the ones the budget plans and pays for, line by line.
Where to start
- Check the calendars: the standard calendars of your countries are already there. Add a custom calendar when a service contract counts days differently.
- Start with the largest services: staff augmentation and technical assistance, where the stakes are most visible. One line per profile, with its quantity, daily rate and period.
- Carry the lines over to the landing with Use for other columns too, then adjust arrival and departure dates during the year.
- Read Staffing by month, then Cost per FTE, and export the table to CSV for Excel, the page to PDF or just the charts to prepare your presentation.
To see all of this on a budget already entered, a free 14-day trial of our hosted version gives access to the sample data of the fictional Fromage & Co group, loaded in a minute. KANAP is fully open source: it can also be installed for free on your own servers.